


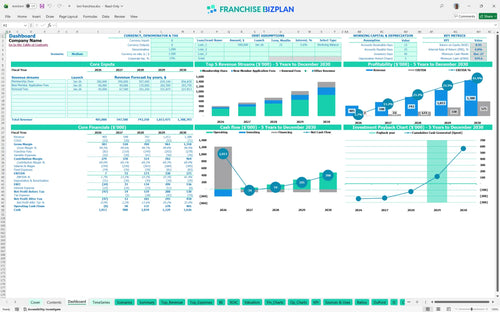
All-in-one Dashboard
Core inputs and core outputs



This comprehensive toolkit includes a dynamic profit and loss statement, cash flow tracker, and automated CAPEX schedule designed specifically for professional networking franchise units.
Core inputs and core outputs
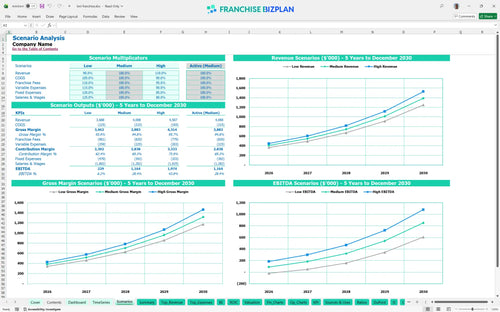
Three scenario analysis
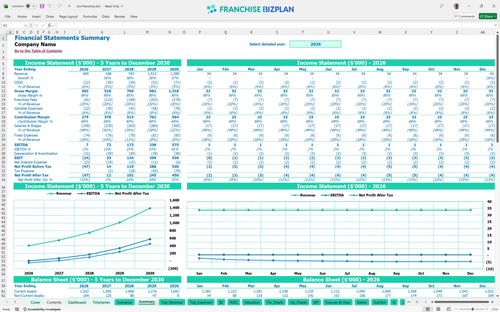
Presentation ready
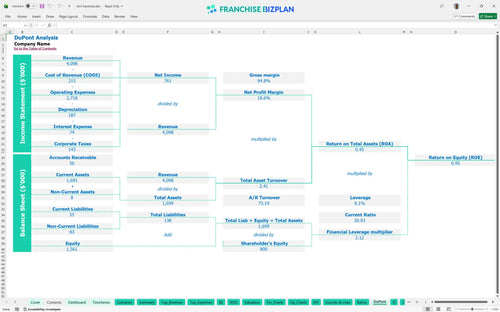
DuPont analysis
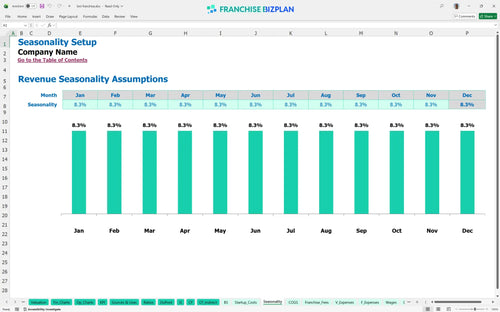
Researched revenue assumptions
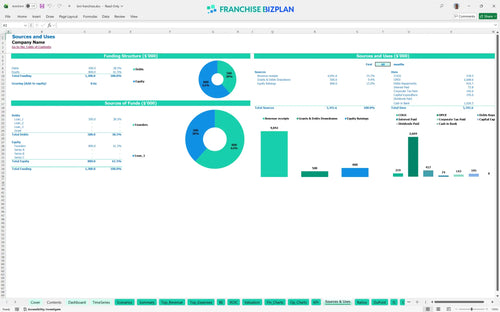
Lender-friendly financial outputs
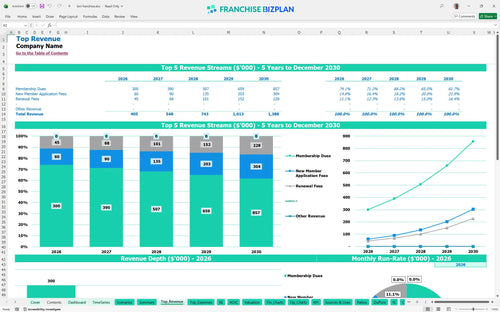
Revenue stream detailed view
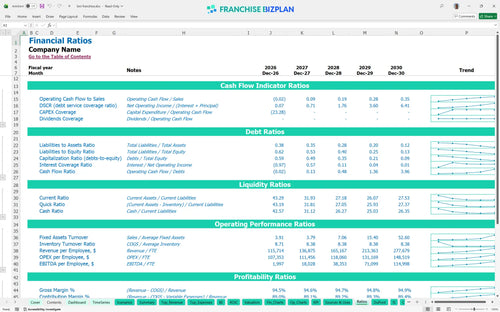
Performance metrics benchmark
We built this franchise profitability calculator using deep research into professional networking unit economics and Austin-area operating costs. All assumptions, including the $200,000 initial membership dues and the 20% royalty structure, are pre-populated but fully editable to match your specific territory and growth goals.
This unit shows a thin $7,000 EBITDA in year one but scales significantly as renewal fees and member dues grow. By year three, you are looking at $173,000 in earnings after accounting for the 20% royalty and staff costs.
You will need approximately $195,000 to get this unit off the ground, plus a cash buffer for the ramp-up period. This covers the $35,000 initial fee and significant tech investments like $55,000 for hybrid meeting gear and $22,000 for website development.
The model projects a 4-year payback period with an Internal Rate of Return (IRR) of 4% and a Return on Equity (ROE) of 0.95. While the initial years are capital-intensive, the long-term member retention financial projections suggest a strong cash flow multiple by year five.
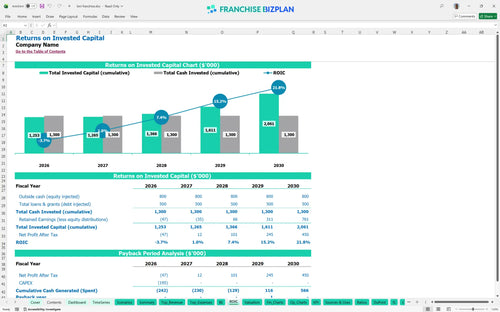
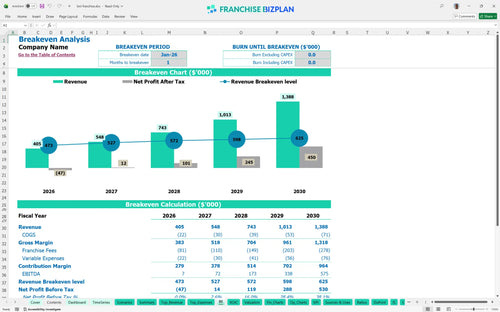
The model shows a fast 1-month break-even date in January 2026, provided you hit the $200,000 year-one revenue target. The biggest hurdle is the $6,150 monthly fixed cost load, which requires consistent new member application fees to stay ahead of the 20% royalty.
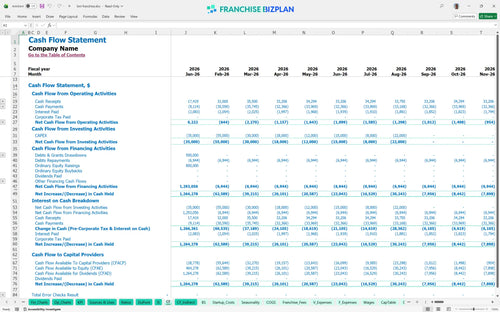
Your lowest cash point is projected for December 2027 at $980,000, assuming you maintain a significant liquidity cushion for expansion. Estimating startup expenses for a networking franchise unit shows that while monthly ops are lean, the initial $195,000 CAPEX drains cash quickly before dues accumulate.
Moving from a medium to a high-growth scenario-where revenue hits $1.38M by year five-dramatically shifts your EBITDA from $7,000 to $575,000. Analyzing recurring revenue in franchise business models proves that even a 10% dip in membership dues can delay your 4-year payback significantly.
Finance: update unit break-even and payback model by Friday.
This franchise unit financial model template is built in Excel with open formulas, letting you tweak every assumption from member dues to venue rent. It defintely simplifies complex projections by allowing you to plug in your specific local market data without starting from scratch.

Map out your growth from $405,000 in year one to over $1.3 million by year five using this franchise business plan template. It provides a clear view of how scaling membership dues and renewal fees impacts your bottom line over a half-decade horizon.

The model accounts for a heavy 20% royalty fee on gross sales, ensuring you see the impact on net margins before you sign. By automating these franchise royalty model calculations, you can see exactly how much cash stays in the unit after the franchisor takes their cut.

Use this franchise investment analysis tool to plan your $195,000 initial capital outlay, covering everything from the $35,000 franchise fee to $55,000 in hybrid meeting equipment. Calculating break-even point for a franchise unit is vital, and this tool shows you exactly when your dues cover the $6,150 in monthly fixed costs.

We've integrated franchise unit financial projections with realistic benchmarks for professional service models, like keeping printed materials around 3% of revenue. These guardrails help you verify if your $75,000 director salary or $3,200 venue rent aligns with profitable networking operations.


Simply purchase and download the financial model template, then access it instantly using Microsoft Excel or Google Sheets. No installation or technical expertise required-just open and start working.

Enter your business-specific numbers, including revenue projections, costs, and investment details. The pre-built formulas will automatically calculate financial insights, saving you time and effort.

Leverage the investor-ready format to confidently showcase your financial projections to banks, franchise representatives, or investors. Impress stakeholders with clear, data-driven insights and professional reports.

Leverage the investor-ready format to confidently present your projections to banks, franchise representatives, or investors.