
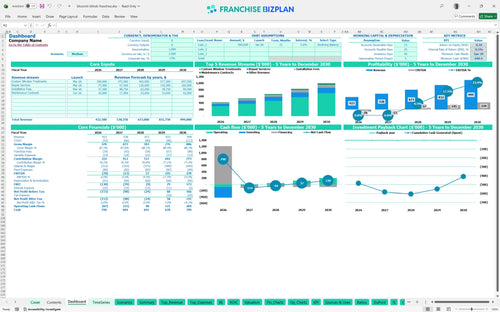
All-in-one Dashboard
Core inputs and core outputs


This mobile franchise business model template provides a comprehensive Excel-based framework for forecasting revenue, expenses, and cash flow for a professional window treatment territory.
Core inputs and core outputs
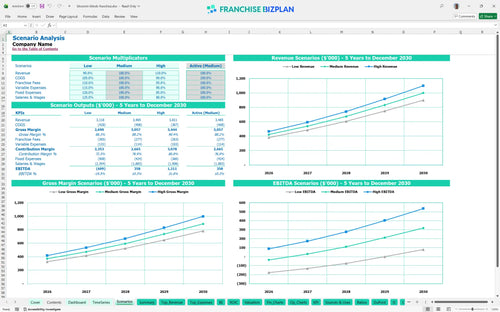
Three scenario analysis
Presentation ready
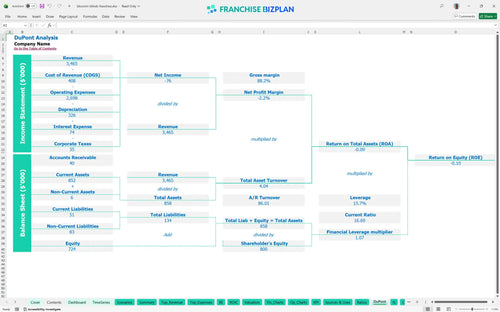
DuPont analysis
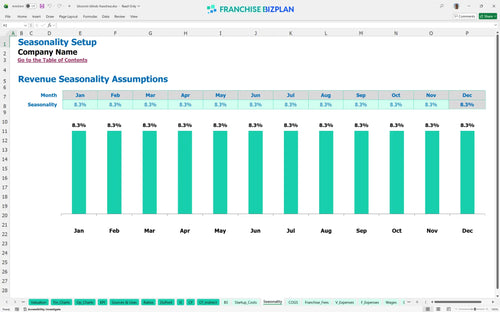
Researched revenue assumptions
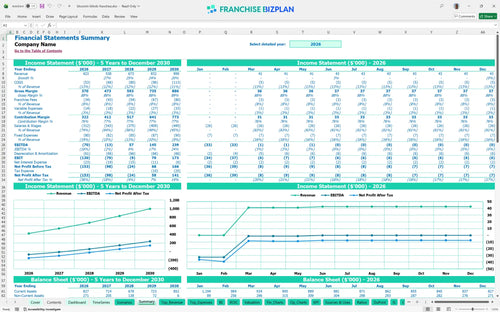
Lender-friendly financial outputs
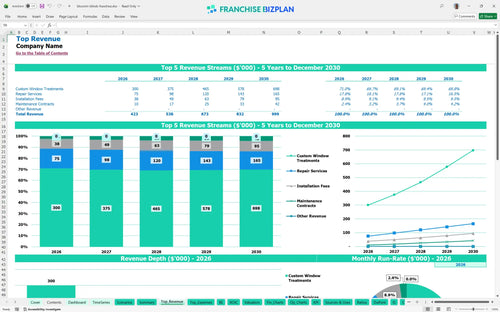
Revenue stream detailed view
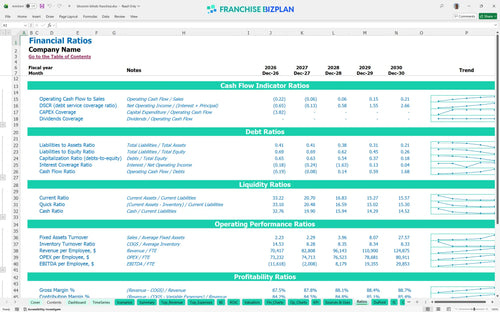
Performance metrics benchmark
We built this financial model for home service franchise owners based on detailed research into mobile service unit economics. The pre-populated data covers everything from the $49,500 franchise fee to the $239,000 year-five EBITDA, providing a realistic starting point for evaluating franchise investment opportunities.
The unit is projected to reach positive EBITDA in year three, hitting $57,000 after navigating initial losses. This trajectory accounts for the gradual ramp-up of custom window treatment sales and repair services as your local brand presence grows.
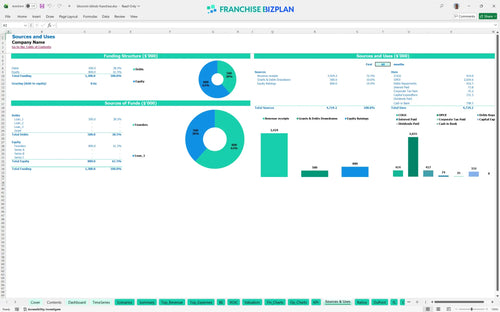
Starting this unit requires approximately $331,500 in capital expenditure, primarily allocated to the $150,000 mobile showroom vehicles and the $49,500 franchise fee. You will also need to cover $45,000 in initial inventory and $25,000 for launch marketing to generate immediate lead flow.
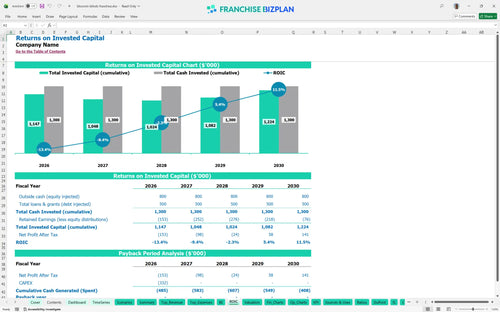
This model shows a long-term play with an IRR of -0.47% over the first five years, meaning the real value is in the mature cash flow. While payback occurs after year five, the unit generates a healthy $239,000 in annual EBITDA by the end of the projection period.
The monthly break-even point is reached in January 2028 when revenue scales to cover $6,650 in fixed monthly overhead and the 8% royalty burden. Estimating royalty fees and overhead correctly is the key to knowing exactly how many installations you need per week to stay in the black.
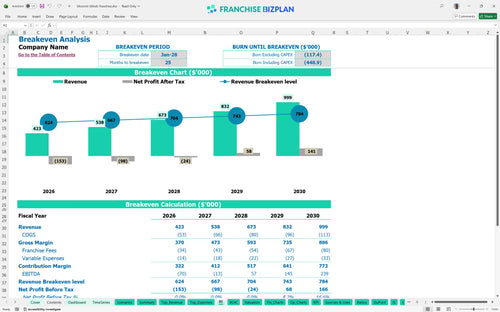
Your lowest cash point defintely occurs in early 2029, requiring a total cash buffer of $640,000 to navigate the 25-month break-even window. Financial planning for new franchise owners must prioritize this liquidity to handle the timing gaps between opening costs and mature-unit performance.
The high scenario significantly improves your year-one outlook by pushing revenue past the $423,000 baseline, which reduces your peak cash need. If local demand allows for higher pricing or better technician productivity, you can reach the $239,000 profit milestone much sooner than the medium case suggests.
This franchise unit financial model is fully customizable in Excel, allowing you to adjust every variable from service mix to local labor rates. It comes with pre-filled formulas and editable assumptions, so you can quickly see how changing your average ticket or technician count impacts the bottom line. It is a practical franchise investment calculator designed to move as fast as your business does.

Planning a mobile service territory requires a long-term view of how revenue projections scale alongside your fleet. This model tracks your path from a $423,000 year-one start to nearly $1 million in annual revenue by year five, providing a clear ROI analysis for multi-unit or single-territory operators. It captures the transition from initial losses to a mature $239,000 annual EBITDA, helping you manage expectations during the ramp-up phase.

Franchise financial obligations like the 6% royalty and 2% marketing fund are non-negotiable, so we built them into the core logic. This ensures your franchise unit operational expenses template accurately reflects the 8% off-the-top cost that scales with your growth. By automating these calculations, you can focus on store-level margins without forgetting the brand-level commitments found in your franchise disclosure document.

How to calculate franchise startup costs becomes simple when you account for the $150,000 vehicle fleet and $49,500 franchise fee upfront. This franchise unit break-even analysis identifies the exact month-projected at month 25-where your revenue finally covers the $6,650 in monthly fixed costs like warehouse rent and fleet insurance. It is a vital tool for estimating your total capital expenditure and the sales volume needed to reach daylight.

This small business financial forecasting Excel tool incorporates built-in industry benchmarks to help you sanity-check your operating expenses. With window treatment franchise profit margins often squeezed by material costs, the model sets material COGS at a researched 10.5% starting point. These guardrails help you compare your expected performance against typical ranges for labor, fuel, and occupancy in the home service sector.


Simply purchase and download the financial model template, then access it instantly using Microsoft Excel or Google Sheets. No installation or technical expertise required-just open and start working.

Enter your business-specific numbers, including revenue projections, costs, and investment details. The pre-built formulas will automatically calculate financial insights, saving you time and effort.

Leverage the investor-ready format to confidently showcase your financial projections to banks, franchise representatives, or investors. Impress stakeholders with clear, data-driven insights and professional reports.

Leverage the investor-ready format to confidently present your projections to banks, franchise representatives, or investors.