
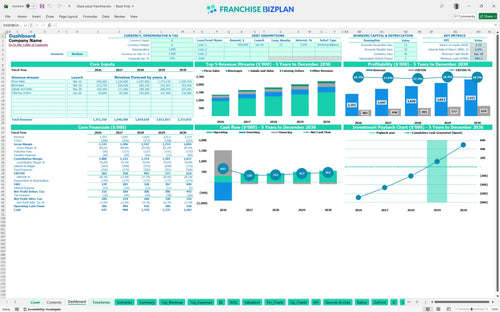
All-in-one Dashboard
Core inputs and core outputs


This Excel template for franchise unit financial projections provides a complete toolkit for modeling a high-volume pizza operation.
Core inputs and core outputs
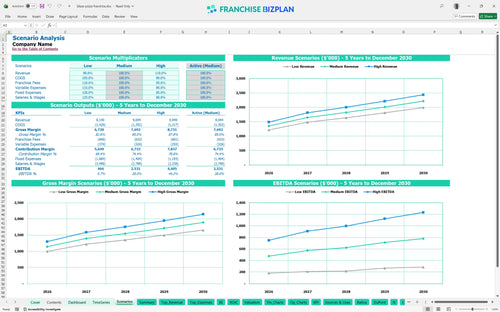
Three scenario analysis
Presentation ready
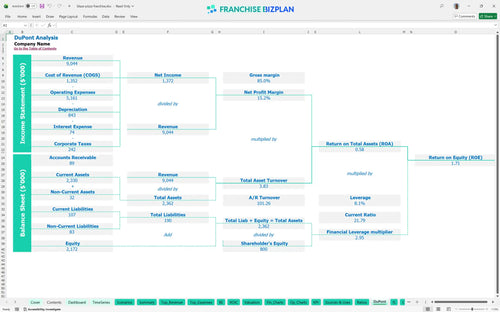
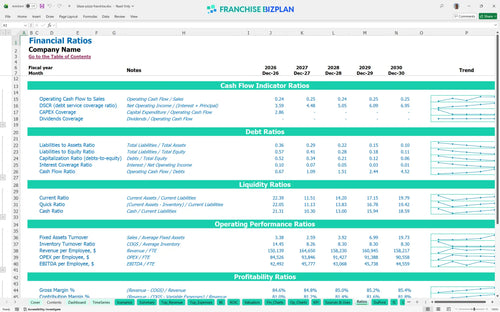
DuPont analysis
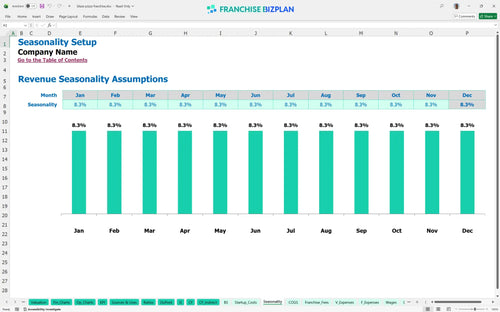
Researched revenue assumptions
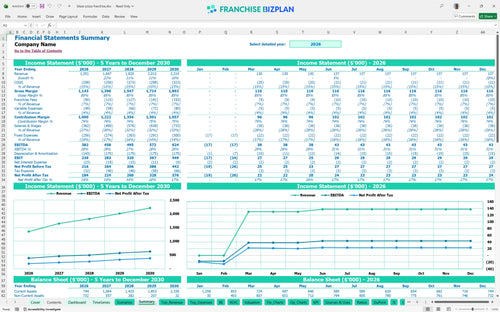
Lender-friendly financial outputs
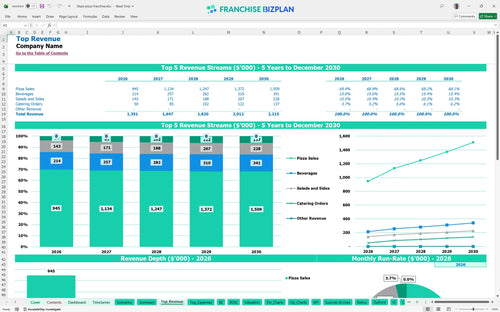
Revenue stream detailed view
Performance metrics benchmark
We developed this restaurant franchise unit economic analysis tool using deep research into the fast-casual pizza sector. The pre-populated assumptions-including the $1.35M year-one revenue and $382,000 EBITDA-are fully editable to fit your specific market. Data-driven decisions beat gut feelings every time.
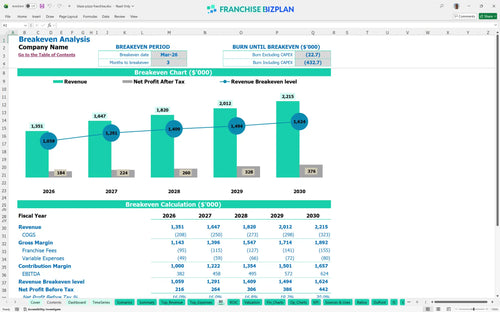
Based on the pizza franchise profit and loss statement template, the unit hits its break-even date in March 2026, just three months after opening. The EBITDA calculation shows a strong $382,000 in the first year, even after accounting for the 5% royalty and 2% marketing fees. Speed to profit is the best way to de-risk your investment.
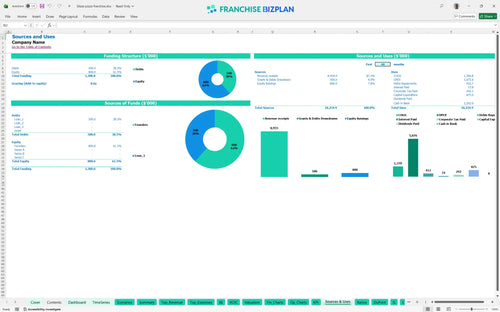
Learning how to calculate startup costs for a pizza franchise is the first step toward ownership. You will need approximately $875,000 for the initial build-out and equipment, plus a $485,000 cash buffer. Your build-out budget is the foundation of your future ROI.
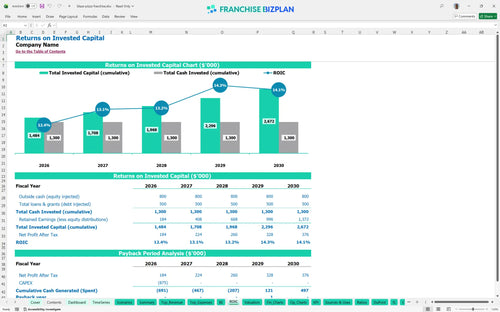
The franchise investment ROI model indicates a 4-year payback period and an IRR of 3.57%. While the initial years focus on recouping the $875,000 CAPEX, the ROE of 1.71 shows the long-term value of the equity. A four-year payback requires disciplined expense management.
The monthly break-even point is reached in month 3, provided you hit the projected volume of roughly $112,000 per month. Restaurant overhead costs, led by the $15,000 monthly rent and $72,000 manager salary, create a high floor. Fixed costs don't blink, so your volume can't either.
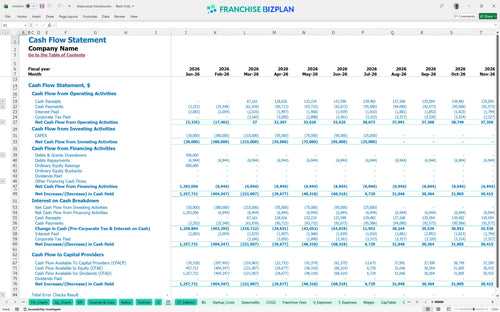
The financial planning guide for new franchise owners highlights June 2026 as the lowest cash point, with $485,000 remaining. If sales lag by even 10%, your runway tightens defintely, making a cash buffer mandatory. Cash is oxygen; don't let your runway get too short.
Analyzing profitability of a fast casual pizza unit requires looking at how a 20% drop in traffic impacts your debt coverage. The model shows how to forecast revenue for a new pizza restaurant by testing Low, Medium, and High scenarios. Planning for the worst helps you achieve the best.
Finance: update unit break-even and payback model by Friday.
This pizza franchise financial model is built in Excel to be fully customizable. You can adjust the pre-filled formulas and editable assumptions to match your specific territory or local labor rates. Every 1-point margin leak matters fast in a single-unit model.

Planning for the long haul is vital in the fast-casual space. This fast casual restaurant business plan template provides a detailed 5-year view of revenue, costs, and cash flow. Long-term success depends on consistent traffic, not just a big opening week.

Managing the franchisor's cut is non-negotiable. Based on a franchise disclosure document analysis, the model tracks the 5% royalty and 2% marketing fund fee against your monthly sales. Royalties come off the top, so your gross margin must be bulletproof.

Use the franchise startup cost calculator to map out your initial outlays, from the $30,000 franchise fee to the $380,000 build-out. Estimating break-even point for restaurant franchise operations shows exactly when your daily sales cover your $15,000 monthly rent. Knowing your break-even revenue keeps you focused on the daily sales target.

This restaurant unit economics spreadsheet includes built-in benchmarks for labor and food costs. If your food ingredients hit 13.5%, use the franchise unit operational cost spreadsheet to compare that to industry norms. Benchmarks are the guardrails that keep your labor costs from spiraling.


Simply purchase and download the financial model template, then access it instantly using Microsoft Excel or Google Sheets. No installation or technical expertise required-just open and start working.

Enter your business-specific numbers, including revenue projections, costs, and investment details. The pre-built formulas will automatically calculate financial insights, saving you time and effort.

Leverage the investor-ready format to confidently showcase your financial projections to banks, franchise representatives, or investors. Impress stakeholders with clear, data-driven insights and professional reports.

Leverage the investor-ready format to confidently present your projections to banks, franchise representatives, or investors.