
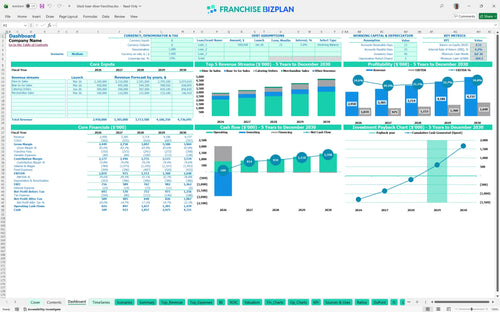
All-in-one Dashboard
Core inputs and core outputs


This restaurant business plan Excel provides a comprehensive suite of tools to analyze franchise profitability and revenue streams for a casual dining unit.
Core inputs and core outputs
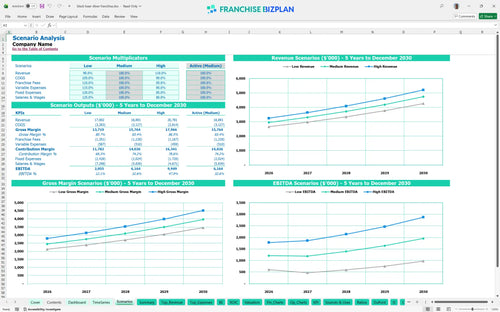
Three scenario analysis
Presentation ready
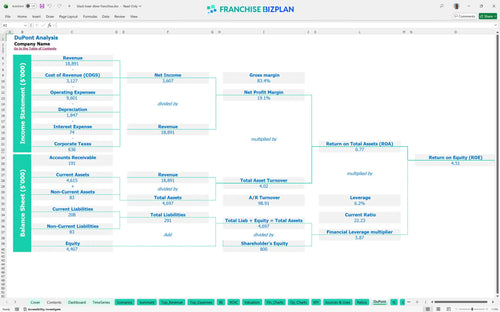
DuPont analysis
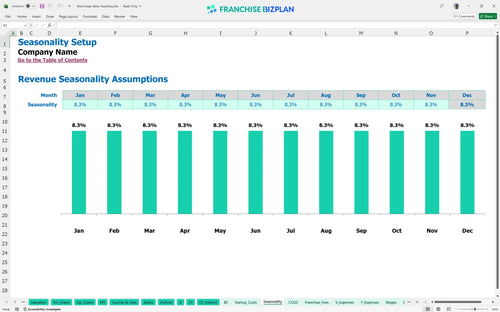
Researched revenue assumptions
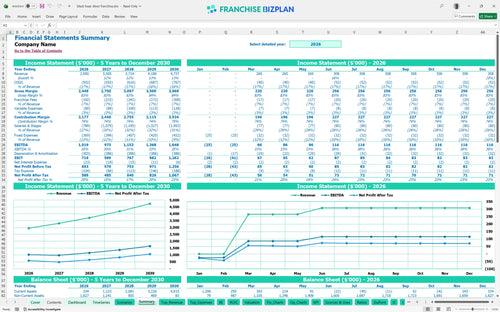
Lender-friendly financial outputs
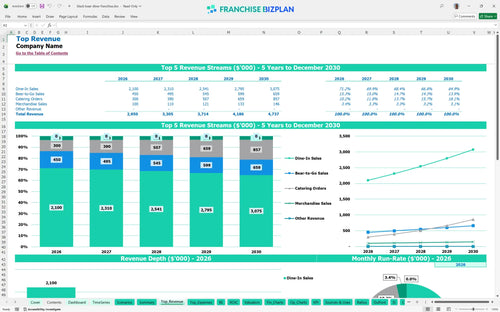
Revenue stream detailed view
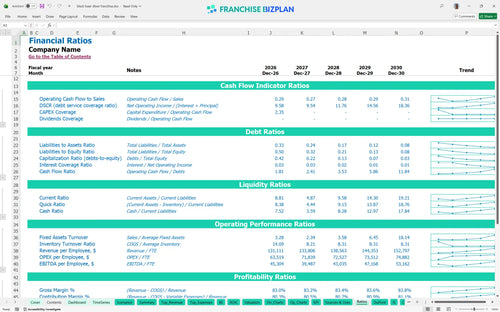
Performance metrics benchmark
We built this franchise unit financial model using our own research to ensure it reflects real-world casual dining operations. Key assumptions, including a $2.95M first-year revenue target and a 4.5% royalty fee, are pre-populated and fully editable to match your specific location. This tool helps you bridge the gap between a brand's high-level estimates and your actual store-level margin.
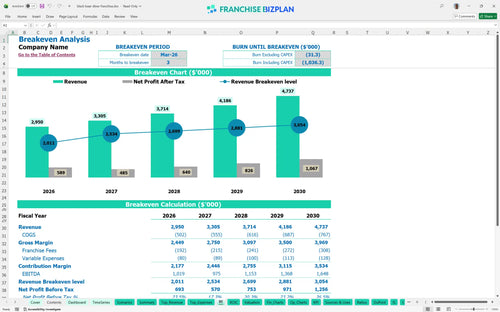
This franchise unit is projected to reach its break-even date in March 2026, just three months after the initial launch. With a Year 1 EBITDA of $1,019,000, the model shows a strong trajectory as dine-in sales and catering orders ramp up throughout the first year of operation.
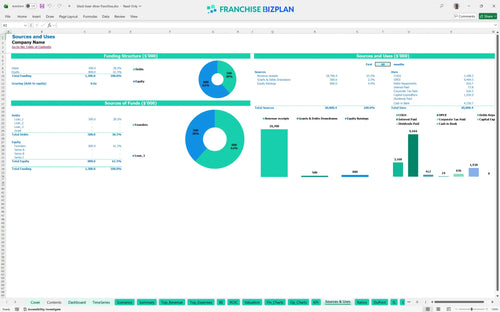
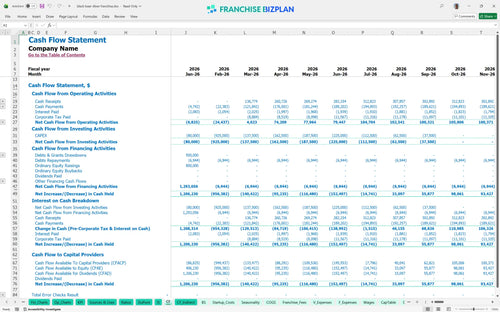
To launch this unit, you will need to manage a significant CAPEX budget, including $900,000 for leasehold improvements and $450,000 for kitchen equipment. When you add the $55,000 franchise fee and $200,000 for furniture, the total initial investment requires careful cash management, especially as the lowest cash point hits -$270,000 in July 2026.
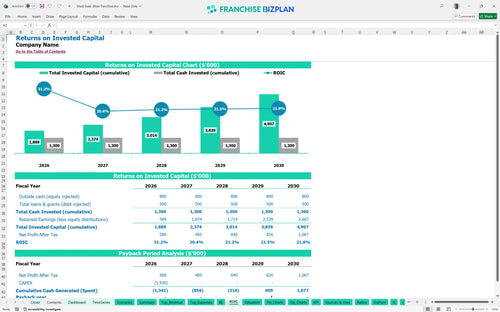
The franchise investment return analysis indicates an Internal Rate of Return (IRR) of 4.18% and a Return on Equity (ROE) of 4.51%. Based on these projections, a franchisee can expect a full payback on their initial capital investment within 4 years, assuming revenue grows to $4.7M by Year 5.
The unit needs to cover approximately $32,000 in monthly fixed costs, including $22,000 for prime location rent and $5,000 for utilities. The restaurant franchise unit economics template shows that dine-in volume is the primary driver for hitting break-even, but the 'Bear-to-Go' station provides a vital secondary revenue stream to reach this point faster.
Your restaurant franchise cash flow projection shows the lowest cash balance occurring in July 2026 at -$270,000. This indicates you need a robust working capital buffer to handle the gap between the heavy construction phase and the full maturity of the catering and merchandise revenue streams.
Financial planning for restaurant franchises requires looking at multiple outcomes; a 10% revenue drop defintely extends the payback period beyond 4 years. Conversely, the High scenario shows that if you maximize throughput and table turnover, Year 5 EBITDA can climb to $1,648,000, significantly improving your long-term yield.
This restaurant franchise financial model is fully customizable in Excel, featuring pre-filled formulas and editable assumptions that allow you to adapt the numbers to your specific territory. You can easily adjust inputs for local labor rates, prime real estate costs, and regional supply chain pricing to see how different operating scenarios impact your bottom line.

Planning for a multi-unit rollout or a single flagship requires a clear view of the future, so this tool provides detailed 5-year revenue, cost, and cash flow projections. It enables food service financial forecasting that maps out long-term profitability and balance sheet health, helping you understand how the unit matures over time.

The model captures the real economics of your agreement, including the initial franchise fee and the ongoing royalty fee calculation. By factoring in brand marketing fund contributions, you get a precise look at the cash leaving the unit before you cover your local fixed costs and operating expenses.

Use this franchise startup cost template to estimate your total initial investment, from leasehold improvements to kitchen equipment. The break-even analysis identifies the exact sales volume needed to cover your monthly fixed and variable expenses, ensuring you know your safety margin from day one.

We have integrated industry benchmarks to help you sanity-check your restaurant P&L statement against standard casual dining performance. Compare your labor costs and gross margins against typical ranges to ensure your business plan is realistic and your unit economics are competitive within the market.


Simply purchase and download the financial model template, then access it instantly using Microsoft Excel or Google Sheets. No installation or technical expertise required-just open and start working.

Enter your business-specific numbers, including revenue projections, costs, and investment details. The pre-built formulas will automatically calculate financial insights, saving you time and effort.

Leverage the investor-ready format to confidently showcase your financial projections to banks, franchise representatives, or investors. Impress stakeholders with clear, data-driven insights and professional reports.

Leverage the investor-ready format to confidently present your projections to banks, franchise representatives, or investors.