
All-in-one Dashboard
Core inputs and core outputs


This franchise unit financial statement template provides a complete toolkit for managing distribution route expenses in Excel while projecting 5-year profitability.
Core inputs and core outputs
Three scenario analysis
Presentation ready
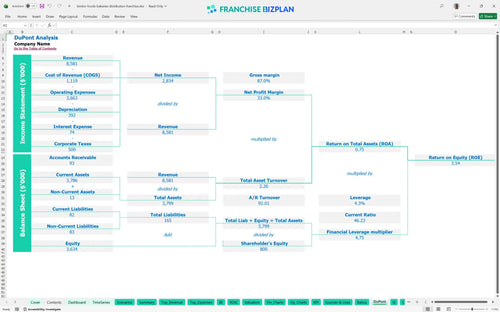
DuPont analysis
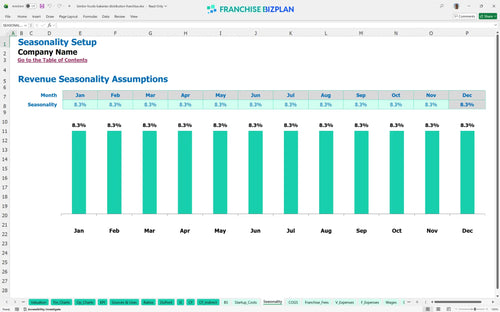
Researched revenue assumptions
Lender-friendly financial outputs
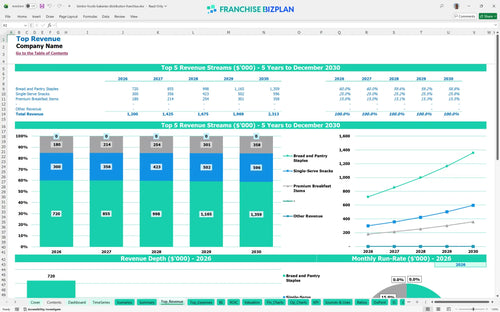
Revenue stream detailed view
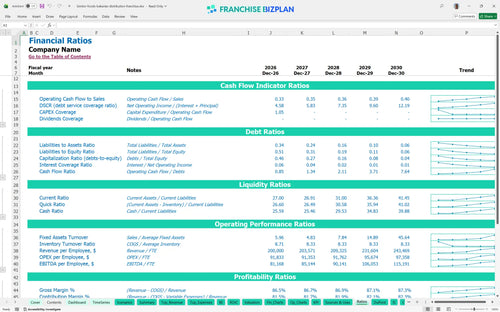
Performance metrics benchmark
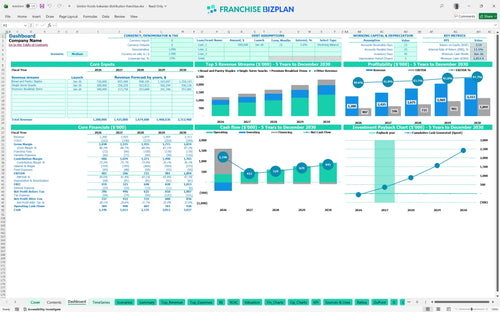
We developed this business plan template for food distribution routes using detailed research on the bakery distribution sector. The model comes pre-loaded with a $1.2 million Year 1 revenue target and a 2-year payback period, though every input is fully adjustable to your specific territory. It is a practical tool for anyone evaluating route acquisition costs and ROI in the current market.
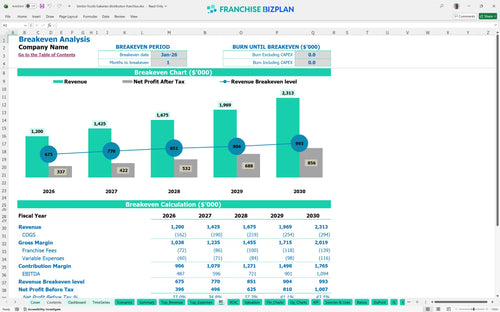
The unit reaches profitability almost immediately, with a break-even date of January 2026. After accounting for the 13.5% total cost of goods and the 6% combined royalty and marketing fees, the model projects a Year 1 EBITDA of $487,000. Profitability is driven by the consistent demand for bread staples and high-margin snacks. Cash flow is king when you are moving perishable goods every morning.
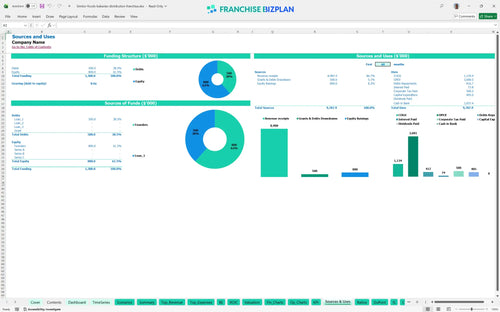
Launching this distribution unit requires a total initial investment of $405,000. This capital covers the $50,000 franchise fee, $180,000 for delivery vehicles, and $75,000 for warehouse setup. You also need to account for initial inventory and merchandising equipment to service your accounts properly. Your fleet is your biggest asset and your biggest expense.
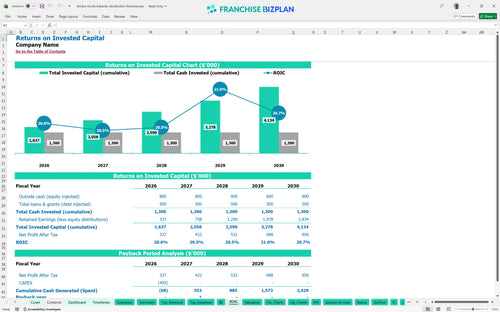
You can expect an Internal Rate of Return (IRR) of 11.55% and a Return on Equity (ROE) of 3.54 based on the researched data. The payback period is relatively short at 2 years, which is excellent for a business with such high physical asset requirements. By Year 5, the model projects EBITDA to grow to $1,094,000 as revenue scales. Speed to payback reduces your long-term financial risk defintely.
The monthly break-even point is reached in the very first month of operation, January 2026. This is possible because the Year 1 revenue of $1.2 million far exceeds the fixed costs like the $4,500 monthly warehouse rent and the $75,000 distribution manager salary. The main lever for staying above break-even is maintaining high volume at your major retail stops. High drop sizes make every mile more valuable.
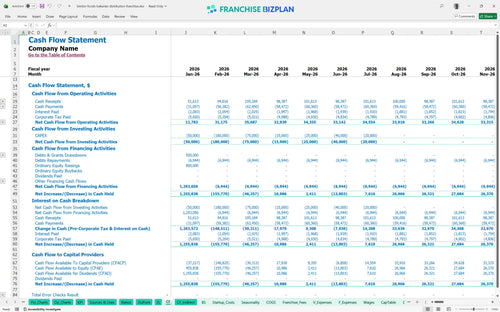
The lowest cash point is projected to be $1,053,000 in June 2026. While the business is profitable, the timing of capital outlays for vehicles and warehouse setup requires you to maintain a healthy liquidity buffer. You should plan for at least six months of operating runway to handle any fluctuations in fuel prices or retail demand. Cash is your insurance policy against a bad month on the road.
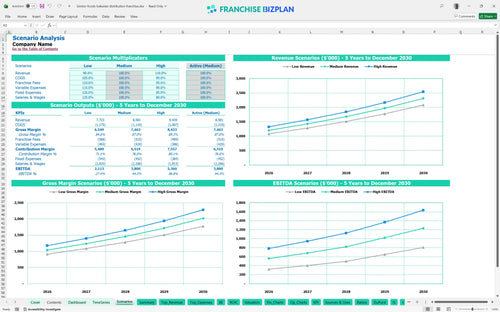
In a High scenario, increasing your route density and snack mix can push Year 1 margins significantly higher since fixed costs like rent and admin salaries stay flat. The Medium scenario assumes steady growth from $1.2 million to $2.3 million over five years, while a Low scenario would test your ability to service debt if fuel costs spike. Success is about how well you manage the middle of the profit and loss statement. Small gains in efficiency lead to big jumps in net income.
Finance: update unit break-even and payback model by Friday.
This bread route financial model is built in Excel with editable assumptions that let you adjust delivery frequencies and stop counts. You can modify the pre-filled formulas to match your specific territory and vehicle costs. It is a flexible route distribution business spreadsheet designed for quick scenario testing. One right turn on a route can save thousands in fuel each year.

Plan your long-term growth with this bakery distribution franchise model that tracks revenue and cash flow over 60 months. It helps you see how adding more drivers or vehicles impacts your total route business ROI analysis. The model provides a clear view of your balance sheet as you scale from one route to several. Long-term wealth in distribution comes from route density, not just distance.

This franchise financial projection template handles the heavy lifting of calculating your 5% royalty and 1% marketing fund obligations. By automating these franchise-specific costs, you can see your true take-home pay after the franchisor takes their cut. It ensures your financial forecasting for DSD franchise routes remains accurate to the penny. Net profit only counts after the franchisor gets their piece.

Our bakery route startup cost breakdown includes everything from the $50,000 initial fee to the $180,000 fleet investment. This tool helps you find the exact sales volume needed to cover your $4,500 monthly warehouse rent and other fixed overhead. It simplifies the process of analyzing cash flow for delivery franchises during the critical first year. Knowing your floor is just as important as knowing your ceiling.

This Excel template for bread distribution franchise use includes built-in benchmarks for fuel, labor, and maintenance. You can compare your 3% fuel cost and 2% logistics fees against industry standards to ensure you are running a lean operation. It acts as a sanity check for your inventory management spreadsheet and overall performance. Benchmarks keep your expectations grounded in the reality of the road.


Simply purchase and download the financial model template, then access it instantly using Microsoft Excel or Google Sheets. No installation or technical expertise required-just open and start working.

Enter your business-specific numbers, including revenue projections, costs, and investment details. The pre-built formulas will automatically calculate financial insights, saving you time and effort.

Leverage the investor-ready format to confidently showcase your financial projections to banks, franchise representatives, or investors. Impress stakeholders with clear, data-driven insights and professional reports.

Leverage the investor-ready format to confidently present your projections to banks, franchise representatives, or investors.