


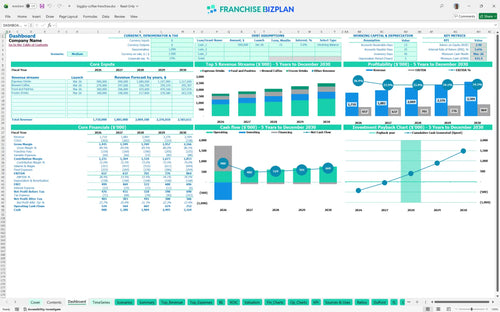
All-in-one Dashboard
Core inputs and core outputs



This coffee shop franchise unit financial performance template provides a complete Excel-based toolkit for forecasting revenue, managing operating expenses, and calculating ROI.
Core inputs and core outputs
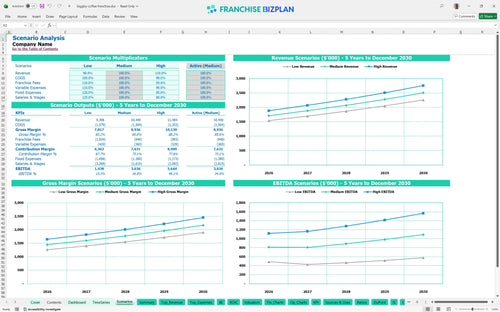
Three scenario analysis
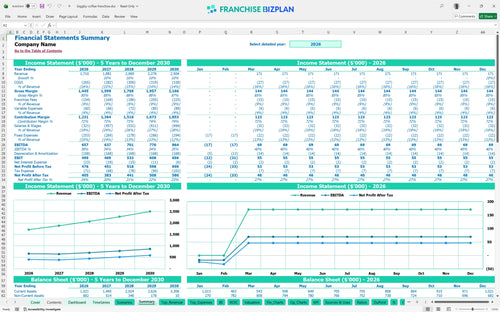
Presentation ready
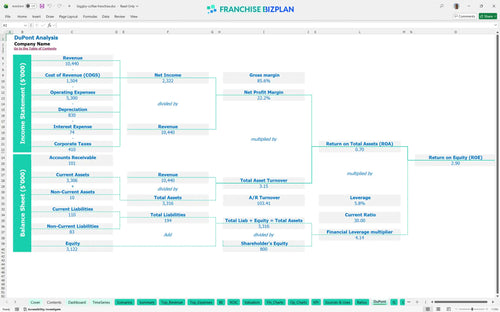
DuPont analysis
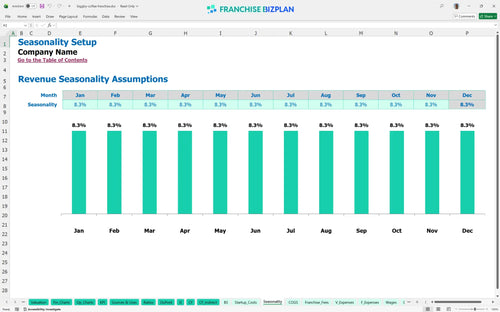
Researched revenue assumptions
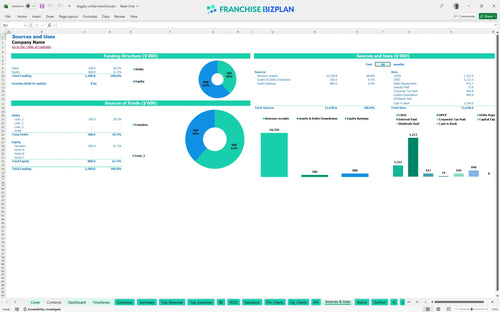
Lender-friendly financial outputs
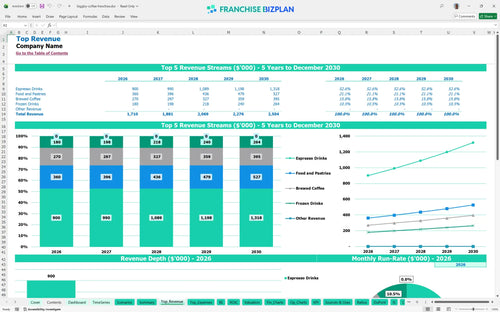
Revenue stream detailed view
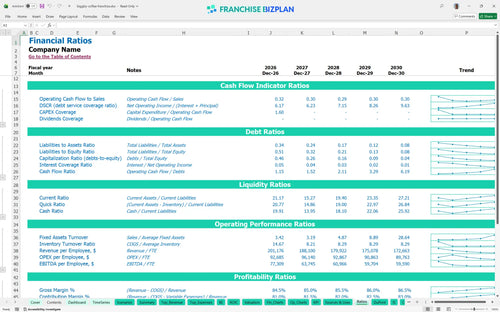
Performance metrics benchmark
We built this franchise unit financial model using our own research on drive-thru coffee operations. Key assumptions like the $1.71M year-one revenue, 6% royalty fees, and $350k leasehold improvements are pre-populated and fully editable. This tool helps you see if the 5.65% IRR and 3-year payback meet your investment hurdles.
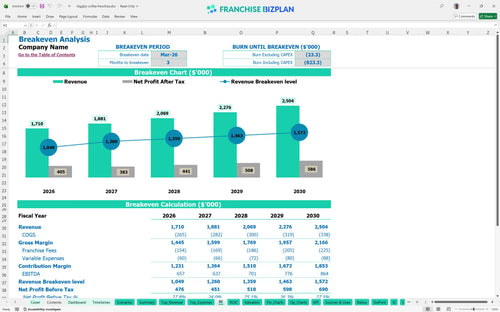
The unit hits profitability quickly, reaching its break-even date in March 2026, just three months after launch. With Year 1 EBITDA projected at $657,000, the model accounts for the 6% royalty and 3% marketing fees while maintaining healthy margins. Profitability is driven by high-volume espresso sales and a disciplined approach to the $15,000 monthly rent.
You will need approximately $840,000 to get this unit off the ground in the US. This covers everything from the $20,000 initial fee to the heavy lifting of leasehold improvements and drive-thru infrastructure. Understanding how to calculate startup costs for a coffee franchise is easier when you see the capital expenditure forecasting mapped out by month before the doors even open.
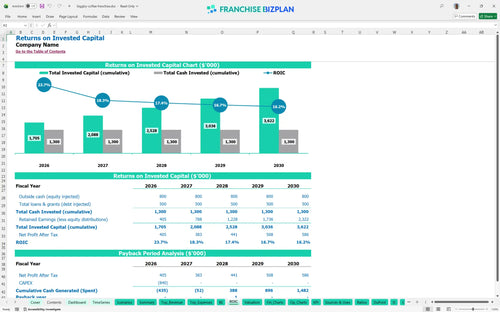
Investors can expect an Internal Rate of Return (IRR) of 5.65% and a Return on Equity (ROE) of 2.9. The payback period is 3 years, which is standard for a high-CAPEX retail build-out. Using a coffee shop investment return on investment calculator helps you see that while the initial spend is high, the consistent cash flow from a $1.7M+ revenue base provides a stable ROI calculation over the five-year term.
The monthly break-even point occurs in Month 3, provided you hit the projected volume of espresso and brewed coffee sales. A financial feasibility study for drive-thru coffee locations shows that throughput is the biggest driver; if your drive-thru lanes move slowly, your break-even timeline will slide. Still, with a $15,000 rent, you need consistent morning traffic to cover fixed costs.
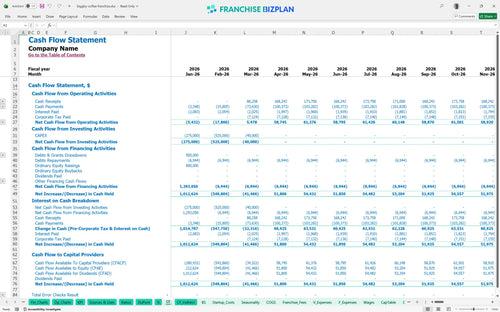
The lowest cash point is $421,000, occurring in March 2026 during the initial ramp-up phase. You need a solid cash buffer to handle the time between the $350,000 leasehold spend and the first month of full revenue. To be fair, the feasability of the model depends on having enough working capital to survive the construction and training months without running dry.
Switching between Low, Medium, and High scenarios shows how a 10% drop in traffic can delay your 3-year payback. When you learn how to forecast revenue for a specialty coffee franchise, you see that the High case relies on maximizing the $240,000 food and pastry stream. Small shifts in COGS, currently at 13.5%, can significantly swing your Year 1 $657,000 EBITDA.
This franchise financial model template is fully customizable in Excel, allowing you to swap out our researched data for your specific site details. It features pre-filled formulas and editable assumptions, so you can test different rent prices or labor rates without breaking the math. It is the defintely the most practical coffee shop business plan template for owners who need an Excel financial model for new coffee shop owners to run real-world scenarios.

Long-term planning is vital when you are looking at a $1.7M+ revenue target. This tool provides detailed franchise unit financial projections over a 60-month period, covering everything from initial ramp-up to mature-store performance. By looking at a coffee franchise profitability analysis over five years, you can see how the 10% annual revenue growth impacts your bottom line as labor and food costs shift.

Operating a franchise means you have fixed obligations to the brand that eat into your margin. This model simplifies understanding royalty and marketing fees in coffee franchises by automating the 6% royalty and 3% marketing fund calculations based on your gross sales. It ensures you see the real store-level cash flow after these franchise royalty fees are paid every month, leaving no surprises in your overhead.

Starting a high-volume coffee unit requires significant capital, and our franchise startup cost calculator helps you map out the $840,000 initial investment. The model includes a detailed break-even analysis to show exactly when your monthly revenue covers both your $15,000 rent and variable costs. Knowing your break-even point early helps you manage your cash runway during those critical first few months of operation.

We have included built-in benchmarks to help you sanity-check your operating expenses against industry standards. Whether you are estimating labor and food costs for franchise coffee shops or looking at occupancy limits, these markers keep your plan realistic. If your beverage ingredients (COGS) trend higher than the 13.5% benchmark, the model flags the variance so you can adjust your waste management or vendor pricing.


Simply purchase and download the financial model template, then access it instantly using Microsoft Excel or Google Sheets. No installation or technical expertise required-just open and start working.

Enter your business-specific numbers, including revenue projections, costs, and investment details. The pre-built formulas will automatically calculate financial insights, saving you time and effort.

Leverage the investor-ready format to confidently showcase your financial projections to banks, franchise representatives, or investors. Impress stakeholders with clear, data-driven insights and professional reports.

Leverage the investor-ready format to confidently present your projections to banks, franchise representatives, or investors.