
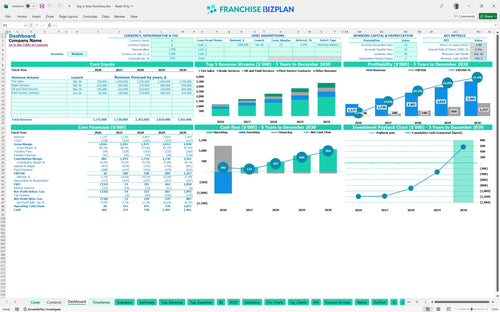
All-in-one Dashboard
Core inputs and core outputs


This franchise unit profit and loss template provides a complete, data-driven framework to forecast revenue, manage automotive service center EBITDA, and plan for long-term ROI.
Core inputs and core outputs
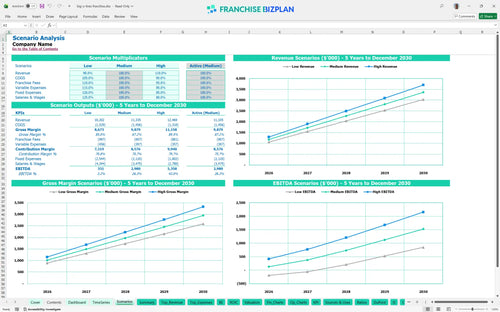
Three scenario analysis
Presentation ready
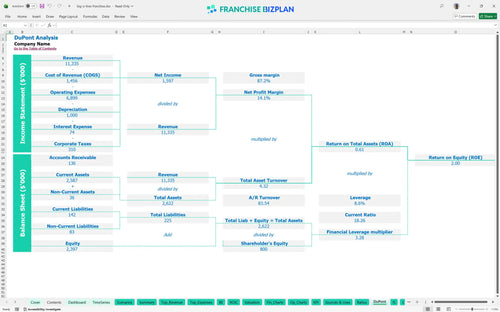
DuPont analysis
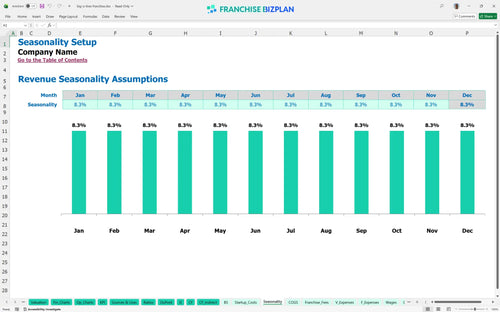
Researched revenue assumptions
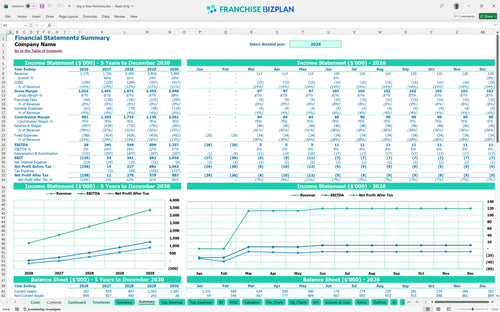
Lender-friendly financial outputs
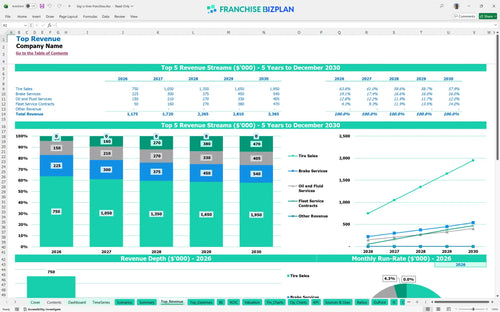
Revenue stream detailed view
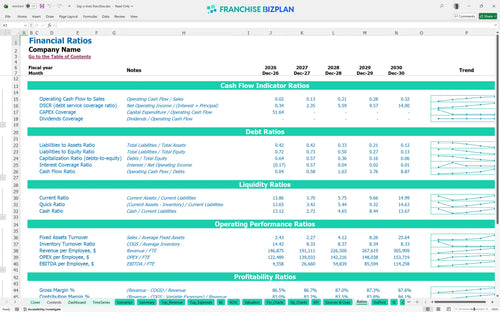
Performance metrics benchmark
We built this franchise unit financial model for small business owners using detailed research on the tire and auto service industry. Key assumptions, including the $35,000 initial fee, 5% royalty, and 3% marketing fund, are pre-populated and fully editable to match your specific location. With Year 1 revenue starting at $1,175,000 and scaling to $3,365,000, this model provides the clarity needed for financial planning for new automotive franchise units.
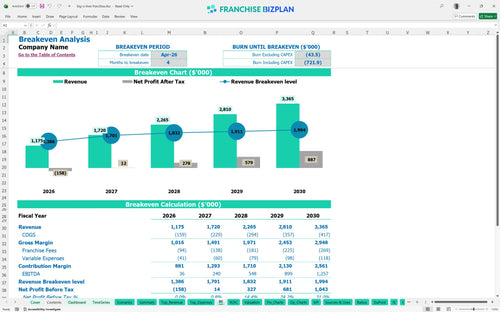
The unit reaches profitability in April 2026, just four months after opening, as service volume ramps up. By Year 3, the automotive service center EBITDA reaches $548,000, eventually climbing to $1,257,000 by Year 5 as fleet contracts mature. Profitability is a volume game here.
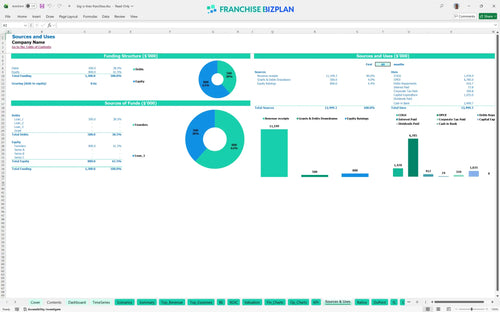
You need significant upfront capital to cover tire shop franchise startup costs, with the largest portion allocated to $450,000 in leasehold improvements. Total equipment costs exceed $450,000, covering everything from lifts to diagnostic tools, plus a $35,000 franchise fee. Equipment is your biggest upfront hurdle.
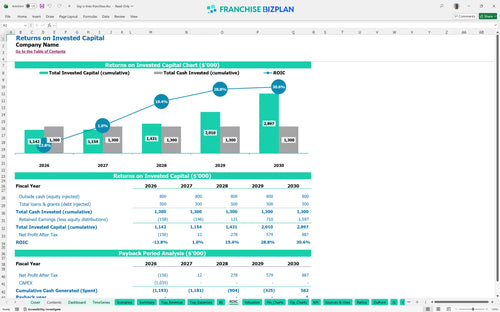
Franchisees can expect a 5-year payback period and an internal rate of return of 2.37% based on the heavy initial CAPEX. While the initial ROI is modest, the Year 5 net margin profile is strong, and the Return on Equity stands at 2. Cash flow is the ultimate scoreboard.
The monthly break-even point occurs in month 4, requiring enough daily traffic to cover $20,000 in rent and over $30,000 in monthly base wages. Success depends on hitting the $500,000 Year 1 tire sales target while managing franchise unit operating expenses. Watch your fixed costs like a hawk.
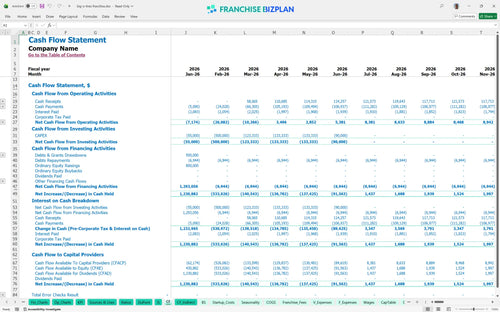
The lowest cash point hits $192,000 in June 2026, which is the critical window where you must manage the gap between inventory purchases and retail receipts. You defintely need to maintain this buffer to handle technician payroll before the fleet service contracts fully scale. Cash is king during the ramp-up.
High-performance scenarios drive Year 5 revenue toward $3.36M, while low-performing units may struggle to cover the 8% total franchise fees if sales dip below $1M. Profitability analysis for new auto repair franchise locations shows that even a 2% shift in parts COGS significantly impacts the 5-year payback. Execution separates the winners.
Finance: update unit break-even and payback model by Friday.
This franchise financial model template is a flexible Excel tool designed for precision, featuring pre-filled formulas and editable assumptions that allow you to simulate any territory or shop size. You can adjust every variable from bay count to local labor rates to see how they impact your bottom line.

Build a long-term roadmap with a franchise financial projection spreadsheet that tracks your growth from a single shop to a local powerhouse over 60 months. This view helps you anticipate when to hire more master technicians as revenue climbs from $1.17M in Year 1 to over $3.3M by Year 5.

The model accurately tracks franchise royalty fees and marketing fund contributions to ensure you understand your true store-level margin after the franchisor takes their cut. It accounts for the initial $35,000 fee and ongoing 8% total brand load so there are no surprises in your cash flow.

Use this tool for franchise capital expenditure planning to map out the $450,000 in leasehold improvements and heavy equipment needs. A built-in break-even analysis for franchises shows exactly when your daily car count covers the $20,000 monthly rent and fixed overhead.

This automotive franchise business plan includes industry-standard benchmarks for labor and parts COGS to keep your projections realistic. Comparing your 11% parts cost against industry averages helps you identify margin leaks before they become permanent problems.


Simply purchase and download the financial model template, then access it instantly using Microsoft Excel or Google Sheets. No installation or technical expertise required-just open and start working.

Enter your business-specific numbers, including revenue projections, costs, and investment details. The pre-built formulas will automatically calculate financial insights, saving you time and effort.

Leverage the investor-ready format to confidently showcase your financial projections to banks, franchise representatives, or investors. Impress stakeholders with clear, data-driven insights and professional reports.

Leverage the investor-ready format to confidently present your projections to banks, franchise representatives, or investors.