
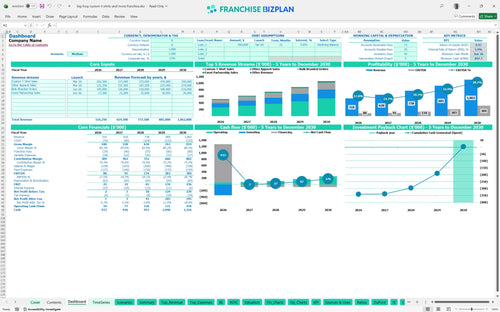
All-in-one Dashboard
Core inputs and core outputs


This franchise business plan template provides a comprehensive Excel financial model template for retail franchise operations, covering everything from initial build-out to five-year cash flow and small business financial forecasting.
Core inputs and core outputs
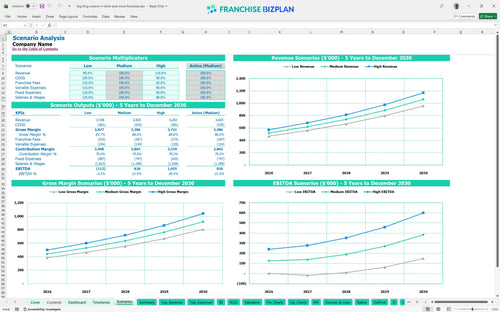
Three scenario analysis
Presentation ready
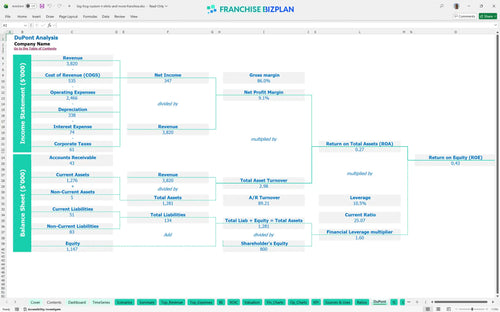
DuPont analysis
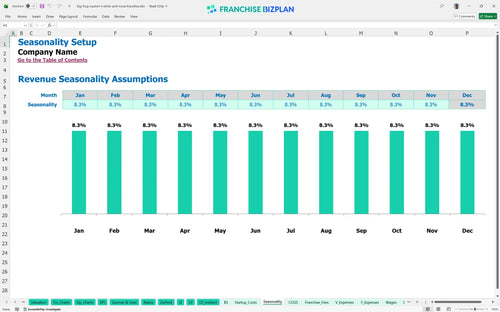
Researched revenue assumptions
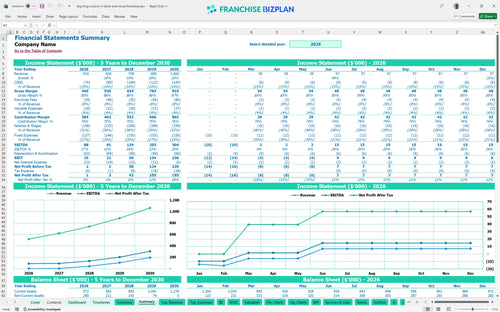
Lender-friendly financial outputs
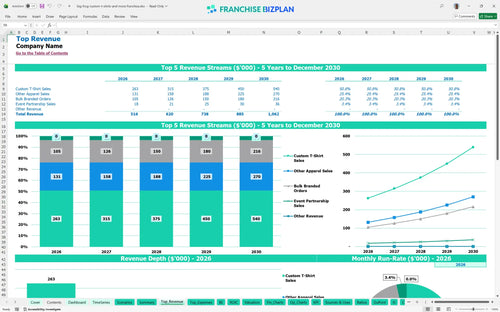
Revenue stream detailed view
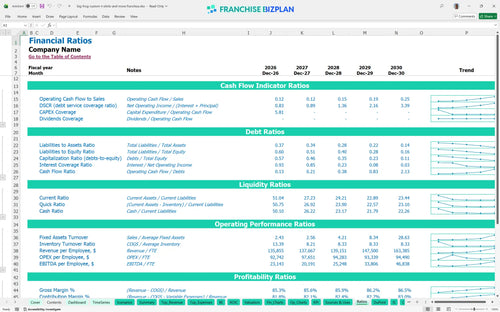
Performance metrics benchmark
We built this custom t-shirt printing franchise model using our own research into unit-level performance. Key assumptions like the $516,000 year-one revenue and 6% royalty are pre-populated with researched data and are fully editable to fit your specific territory. This tool provides the clarity needed to manage a print-on-demand franchise model effectively.
Your unit reaches profitability in June 2026, roughly six months after opening. The profitability analysis for DTG printing business shows EBITDA climbing from $88,000 in year one to $304,000 by year five as you scale bulk orders. Profit is a marathon, not a sprint.
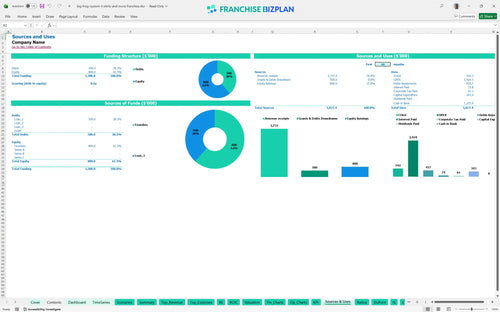
Launching this franchise unit in the US requires approximately $343,000 in initial capital. This budgeting for custom t-shirt franchise startup covers the $60,000 franchise fee, $100,000 for leasehold improvements, and $80,000 for specialized printing equipment. Know where every dollar goes before you spend it.
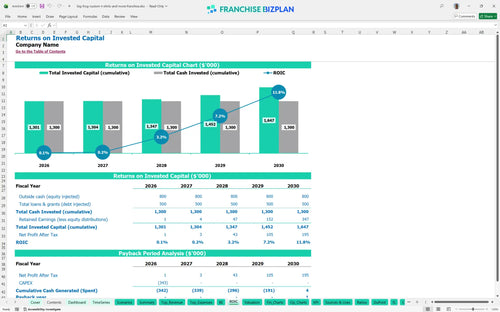
Investors can expect an internal rate of return (IRR) of 1.92% and a return on equity of 0.43. The apparel customization ROI becomes more attractive over time, with a five-year payback period as annual revenue crosses the $1 million mark. Returns take time in a brick-and-mortar world.
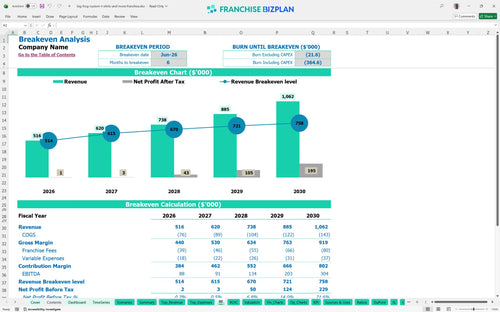
The unit hits its break-even point in June 2026. Reaching this milestone depends heavily on managing the $8,500 monthly rent and ensuring the $516,000 year-one revenue target is met through consistent local marketing. Speed to break-even determines your stress levels.
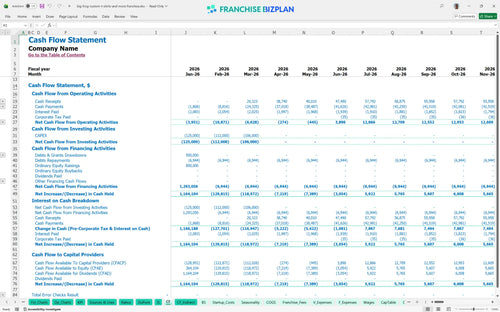
The lowest cash point occurs in June 2026 at $898,000, which includes your initial funding and operating reserves. You should defintely use a franchise unit operating expense tracker to monitor the $11,800 in monthly fixed costs during the first six months. Liquidity is your best insurance policy.
Financial planning for boutique apparel franchise involves testing high and low sales volumes. A high-case scenario significantly improves the how to estimate ROI for a print-on-demand franchise by spreading the $55,000 manager salary over a larger revenue base. Hope is not a strategy, but scenario planning is.
Finance: update unit break-even and payback model by Friday
This franchise financial model template is built in Excel, allowing you to tweak every variable from garment costs to local rent. You can adjust the pre-filled assumptions to match your specific territory, ensuring the retail franchise profit calculator reflects your actual market conditions. Whether you are adjusting for a higher-than-average lease in a prime lifestyle center or lower labor costs in a rural area, the model adapts instantly. This level of customization is vital for multi-unit operators who need to compare performance across different regions. Flexibility is the difference between a guess and a plan.

Map out your long-term growth with detailed 5-year revenue and profit forecasts. This tool provides a clear view of how scaling from $516,000 in year one to over $1,062,000 in year five impacts your bottom line and cash flow. By including financial projections for new franchise locations, you can visualize the ramp-up period and the transition from a single-unit startup to a mature, high-volume operation. It helps you anticipate when to reinvest in new equipment or expand your sales team to sustain momentum. Growth is only good if it's profitable.

Managing the 6% royalty and 1.5% marketing fee is critical for maintaining store-level margins. The model automatically calculates these ongoing obligations based on your sales volume, so you always know your true contribution after brand costs. Understanding these franchise unit economics is essential for any CFO or owner-operator looking to protect their store-level EBITDA. By tracking these fees alongside your variable costs, you can see exactly how much volume is needed to offset the cost of brand support. Royalties are a top-line tax; plan accordingly.

Use this to understand how to calculate startup costs for a custom apparel franchise, including the $60,000 initial fee and $100,000 in leasehold improvements. The break-even analysis for retail custom clothing store helps you identify the exact month you stop burning cash and start generating a surplus. This franchise startup cost analysis breaks down everything from signage to initial inventory, ensuring you don't overlook the small expenses that can drain your working capital during the first 90 days. Cash is king, but break-even is the kingmaker.

We included industry-standard ranges for labor and COGS (Cost of Goods Sold) to help you sanity-check your numbers. Comparing your 11.5% garment blank cost against benchmarks ensures your direct-to-garment printing business stays competitive and profitable. This model helps you identify margin leaks early, such as high ink waste or overstaffing during low-traffic hours. By aligning your projections with proven franchise performance metrics, you reduce the risk of unrealistic expectations and set a solid foundation for your operating plan. Don't fly blind when benchmarks are available.


Simply purchase and download the financial model template, then access it instantly using Microsoft Excel or Google Sheets. No installation or technical expertise required-just open and start working.

Enter your business-specific numbers, including revenue projections, costs, and investment details. The pre-built formulas will automatically calculate financial insights, saving you time and effort.

Leverage the investor-ready format to confidently showcase your financial projections to banks, franchise representatives, or investors. Impress stakeholders with clear, data-driven insights and professional reports.

Leverage the investor-ready format to confidently present your projections to banks, franchise representatives, or investors.