
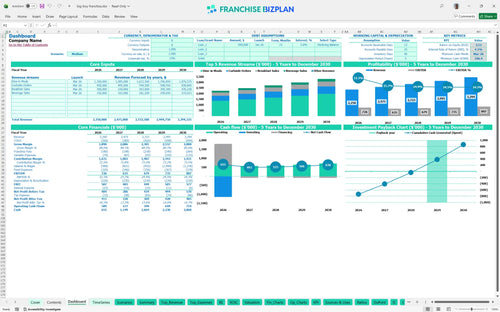
All-in-one Dashboard
Core inputs and core outputs


This franchise startup cost calculator provides a complete toolkit for analyzing unit economics, from CAPEX and staffing to 5-year P&L and cash flow statements.
Core inputs and core outputs
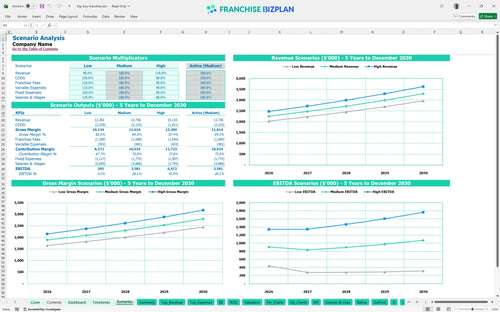
Three scenario analysis
Presentation ready
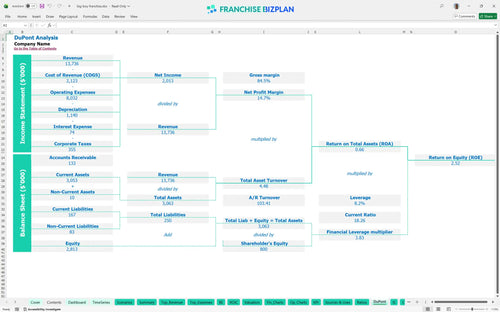
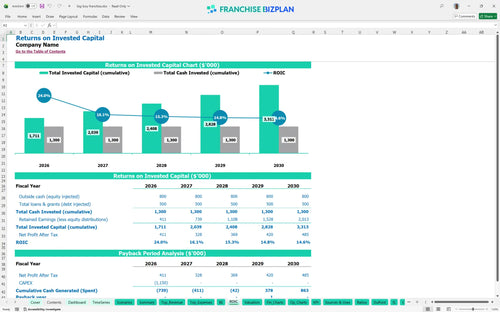
DuPont analysis
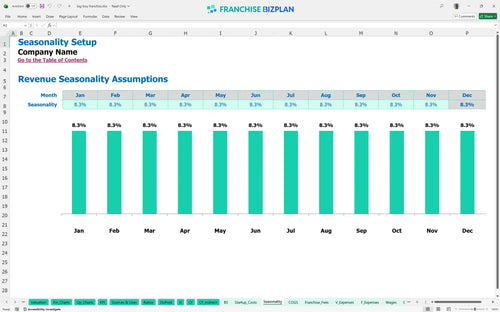
Researched revenue assumptions
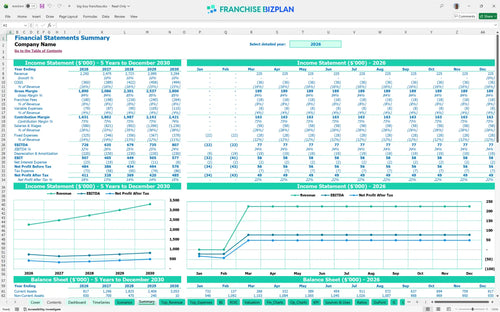
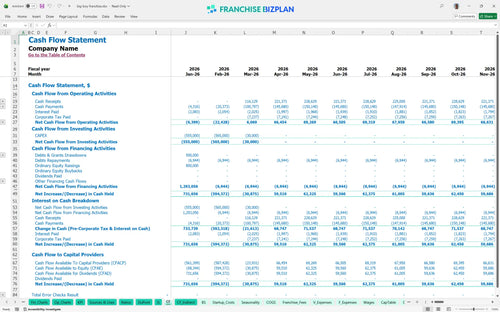
Lender-friendly financial outputs
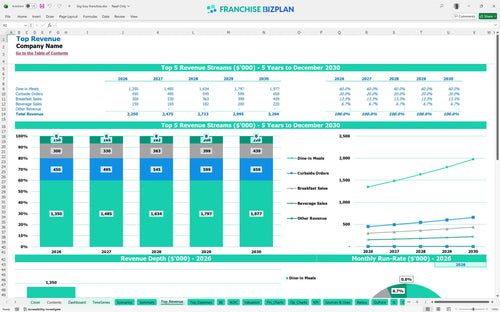
Revenue stream detailed view
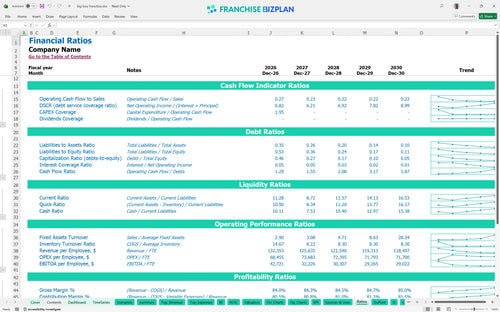
Performance metrics benchmark
We built this franchise unit profitability analysis using detailed research on the concept's operational requirements. The model comes pre-loaded with data like $2.25M in year-one revenue and a $1.15M initial investment, but you can defintely edit every cell to match your local market reality. It's designed to help you move from guessing to knowing before you sign the lease.
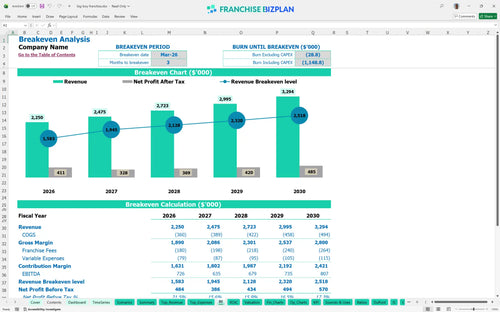
This unit hits its stride quickly, reaching breakeven by March 2026, just three months after launch. While year-one EBITDA is strong at $726,000, the model accounts for rising labor and food costs as you scale. Managing food cost is the key to keeping margins healthy.
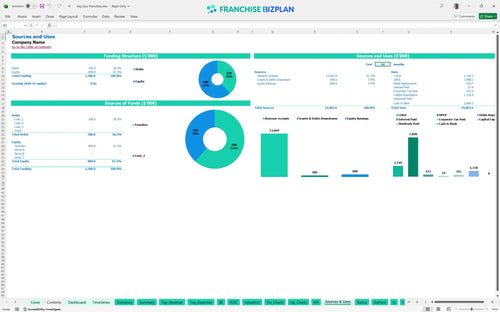
You'll need roughly $1.15M to get this unit off the ground in the US market. This covers everything from the $50,000 franchise fee to the $450,000 in leasehold improvements. We also factor in $250,000 for kitchen equipment and a $106,000 cash buffer to handle the early months.
The model shows a 4-year payback period, which is standard for a high-CAPEX food service financial projection template. With an IRR of 4.09% and a Return on Equity of 2.52, the focus here is on long-term stability rather than a quick flip. Steady EBITDA growth suggests a solid foundation for expansion.
You reach the break-even point in month 3, assuming you hit your monthly revenue targets. The biggest drag on this number isn't the food-it's the $18,000 monthly rent and the $85,000 GM salary. If traffic dips, fixed costs become very heavy, very fast.
Your lowest cash point is $106,000 in March 2026 during the initial ramp-up. This is the danger zone where construction delays or slow hiring can eat your buffer. We recommend keeping at least three months of operating expenses in reserve to handle the ramp-up phase without stress.
The difference between a Low and High case often comes down to local marketing execution and throughput. In a high scenario, pushing revenue toward $3.2M early significantly improves your IRR and shortens the payback. A 10% drop in dine-in sales can push your break-even date out by months.
Finance: update unit break-even and payback model by Friday.
This franchise unit financial model template is built in Excel, meaning you can tweak every variable to fit your specific territory. It includes pre-filled formulas for revenue and costs, but you can easily adjust the inputs for local labor rates or rent. It's a tool for real-world planning, not just a static sheet.

Planning for a single unit requires looking past the grand opening. This food service financial projection template maps out five years of performance, from the initial ramp-up to mature operations. You'll see how a 10% annual revenue growth-climbing from $2.25M to over $3.29M-impacts your bottom line over time.

The franchise royalty fee structure is a major factor in your store-level margin. This model accounts for the 5% royalty and 3% marketing fund contributions right off the top. By tracking these alongside the $50,000 initial fee, you get a clear picture of the total cost of brand alignment.

Estimating break-even point for new restaurant franchise locations is critical for managing your cash runway. With a total setup cost near $1.15M, you need to know exactly when the doors pay for themselves. This tool breaks down leaseholds, equipment, and furniture to show you the path to positive cash flow.

We've baked in industry standards to help you sanity-check your restaurant franchise business plan. Whether it's food costs starting at 14.5% or labor allocations for a full staff, these benchmarks act as a guardrail. If your numbers stray too far from these norms, you'll know where to dig in.


Simply purchase and download the financial model template, then access it instantly using Microsoft Excel or Google Sheets. No installation or technical expertise required-just open and start working.

Enter your business-specific numbers, including revenue projections, costs, and investment details. The pre-built formulas will automatically calculate financial insights, saving you time and effort.

Leverage the investor-ready format to confidently showcase your financial projections to banks, franchise representatives, or investors. Impress stakeholders with clear, data-driven insights and professional reports.

Leverage the investor-ready format to confidently present your projections to banks, franchise representatives, or investors.