
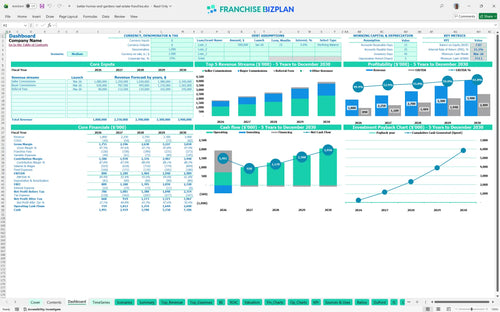
All-in-one Dashboard
Core inputs and core outputs


This template provides a complete Excel template for real estate franchise financial projections, including a real estate brokerage profit and loss statement template and automated cash flow tracking.
Core inputs and core outputs
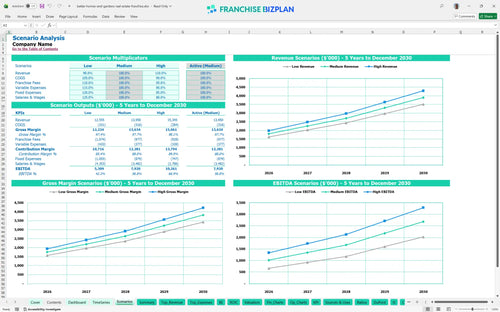
Three scenario analysis
Presentation ready
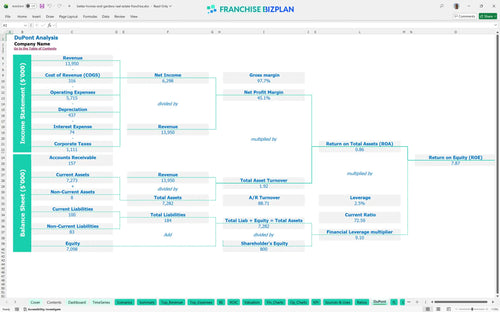
DuPont analysis
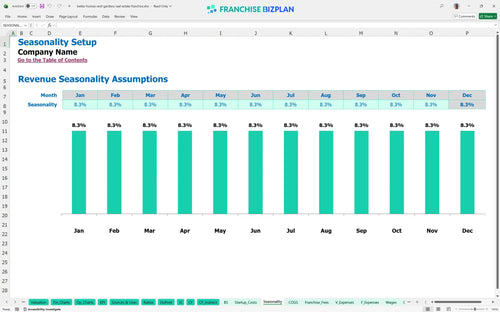
Researched revenue assumptions
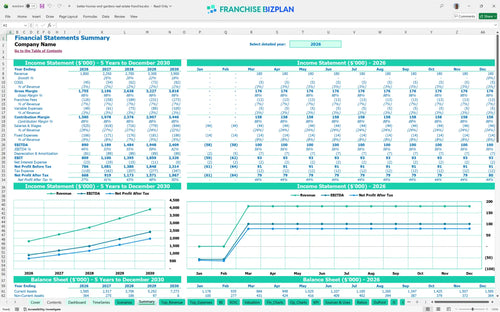
Lender-friendly financial outputs
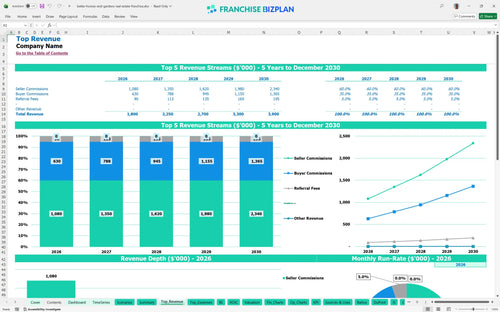
Revenue stream detailed view
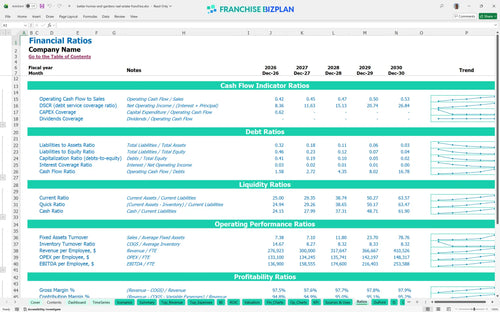
Performance metrics benchmark
We built this franchise unit profitability analysis using our own research into luxury brokerage operations. Key assumptions like the $1.8 million year-one revenue and the $110,000 managing broker salary are pre-populated with researched data specific to the Better Homes and Gardens Real Estate Franchise franchise unit and are fully editable. This model helps you visualize the path to a $2.4 million EBITDA by year five.
The unit hits its stride quickly with a breakeven date of March 2026, just three months after launch. By year five, EBITDA is projected to reach $2,409,000 as your agent team scales from 2.5 to 5.5 full-time equivalents and referral fees grow to $130,000 annually.
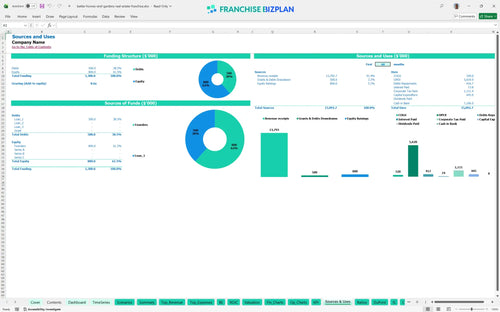
You will need a significant capital injection to launch this real estate franchise investment template, with total startup costs reaching $445,000. This covers the $35,000 franchise fee and a heavy $200,000 investment in office improvements to meet luxury brand standards, plus a cash buffer to reach the $772,000 minimum cash point.
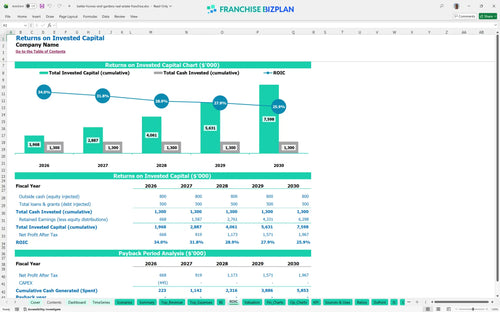
This real estate franchise investment return calculator shows an Internal Rate of Return (IRR) of 15.07% and a Return on Equity (ROE) of 7.87%. While the cash flow is strong, the high initial build-out means the full payback period extends beyond the first five years of operation.
To cover your fixed costs-including the $10,000 rent and $33,000 in monthly base salaries-you need to follow best practices for real estate brokerage financial planning to hit breakeven by March 2026. The main driver here is your agent productivity and the timing of those first luxury seller commissions.
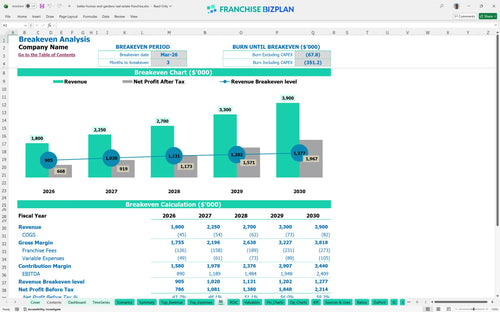
Your lowest cash point is projected to be $772,000 in March 2026, which is why having a solid cash flow analysis for new real estate franchise unit is vital. You'll need enough liquidity to survive the first three months of ramp-up before commissions start flowing consistently from your Westlake Hills listings.
Using a real estate business plan financial forecasting tool lets you see how a 10% drop in buyer commissions affects your year-one margin. High scenarios show EBITDA jumping significantly if you can push referral fees above the $60,000 baseline while keeping fixed costs like the $800 CRM software flat.
This real estate franchise financial model lives in Excel, so you can tweak every assumption to fit your specific Austin territory. We've pre-loaded the formulas for commissions and overhead, but you can easily adjust the split or agent count as your brokerage grows. It's built to be a living real estate brokerage business plan that evolves with your office.

Planning a long-term exit or expansion requires a clear view of the future, and this tool delivers exactly that. You get a full 5-year outlook covering everything from initial seller commissions of $720,000 in year one to a projected $3.9 million in total revenue by year five. This allows you to see how scaling your agent count impacts your bottom line over time.

Estimating franchise royalty and marketing fees for real estate is often where new owners get tripped up. This model bakes in the 6% royalty and 1% marketing fund automatically, so you see the net impact on your cash flow before you even open. It's the easiest way to manage these ongoing franchise operational expenses and franchise royalty fees using a franchise startup cost spreadsheet.

Knowing how to calculate startup costs for a real estate franchise is the first step to avoiding a cash crunch, especially when estimating startup costs for luxury real estate franchise location needs. We've mapped out the $445,000 in initial investment, including that $200,000 leasehold improvement for your boutique space. The model then pinpoints exactly when your commission volume covers your $10,000 monthly rent.

We included benchmarks for real estate agency overhead costs in this financial model for boutique real estate office so you can see if your $110,000 broker salary or $62,000 marketing spend is in line with the luxury market. This helps you sanity-check your numbers against industry standards for high-end boutique offices and real estate business valuation. It's defintely better than guessing on your margins.


Simply purchase and download the financial model template, then access it instantly using Microsoft Excel or Google Sheets. No installation or technical expertise required-just open and start working.

Enter your business-specific numbers, including revenue projections, costs, and investment details. The pre-built formulas will automatically calculate financial insights, saving you time and effort.

Leverage the investor-ready format to confidently showcase your financial projections to banks, franchise representatives, or investors. Impress stakeholders with clear, data-driven insights and professional reports.

Leverage the investor-ready format to confidently present your projections to banks, franchise representatives, or investors.