
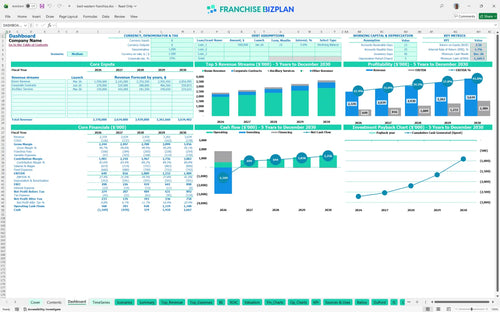
All-in-one Dashboard
Core inputs and core outputs


This hotel franchise financial model template includes a hotel franchise profit and loss statement template, a hotel occupancy rate forecast, and a detailed breakdown of hotel operating expenses.
Core inputs and core outputs
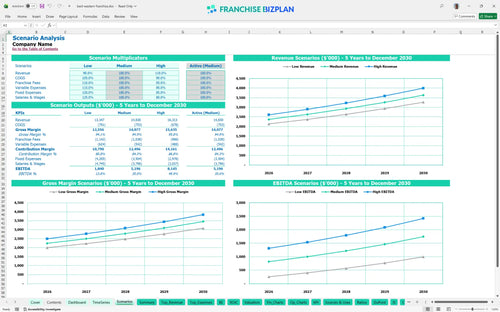
Three scenario analysis
Presentation ready
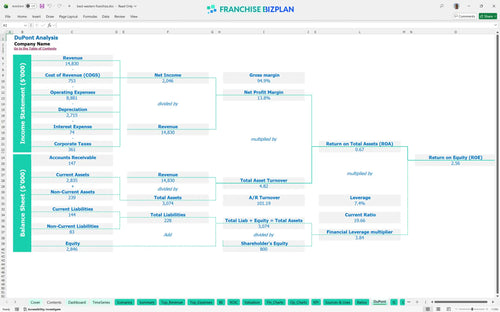
DuPont analysis
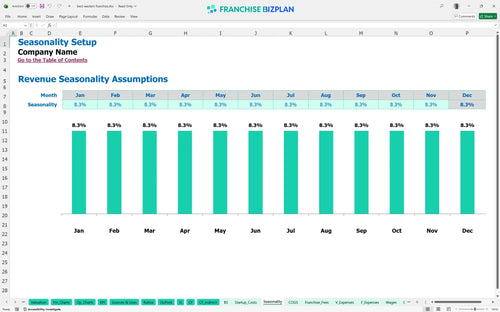
Researched revenue assumptions
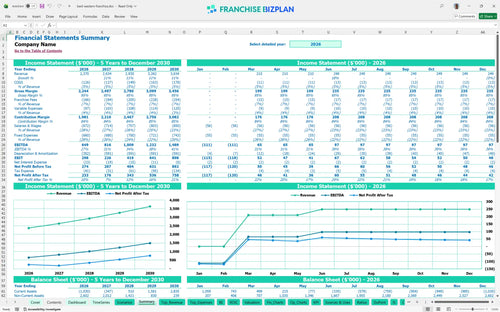
Lender-friendly financial outputs
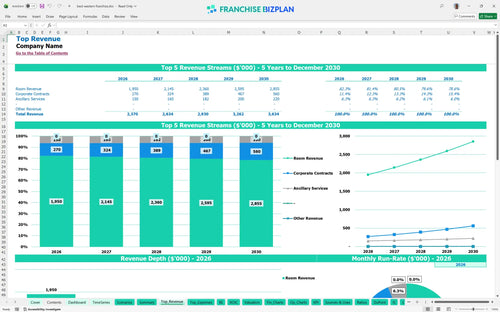
Revenue stream detailed view
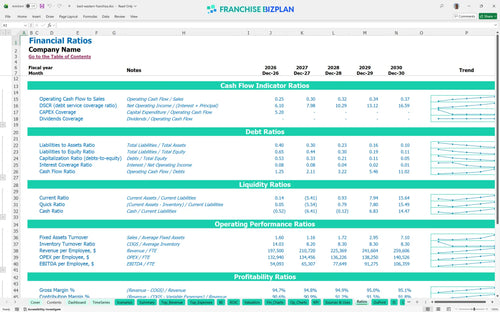
Performance metrics benchmark
We built this hotel franchise financial model using detailed market research to help you navigate the complexities of the hospitality industry. Key assumptions for revenue per available room, hotel operating expenses, and hospitality capital expenditure are pre-populated and fully editable. With an initial EBITDA of $649,000 and a clear path to $1.48 million by year five, this tool provides the data-driven clarity needed for a confident investment.
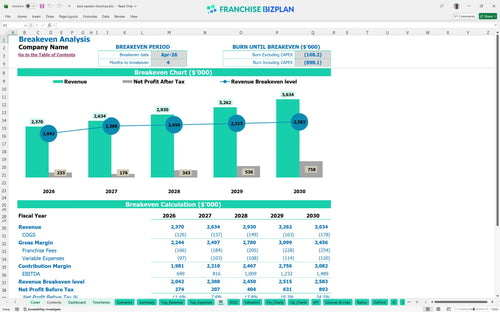
This hotel franchise unit becomes operationally profitable by April 2026, just four months after opening for guests. Every dollar in room revenue counts when you are scaling a midscale asset.
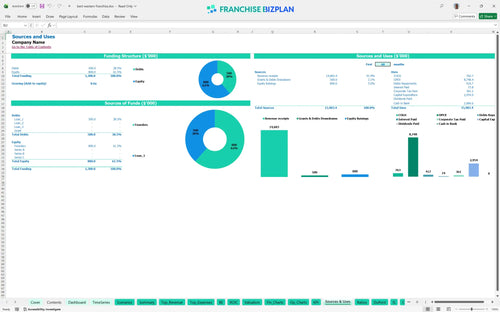
You need approximately $2.95 million in total startup capital to launch this unit in the US market. You need to know where every dollar goes before the first guest checks in.
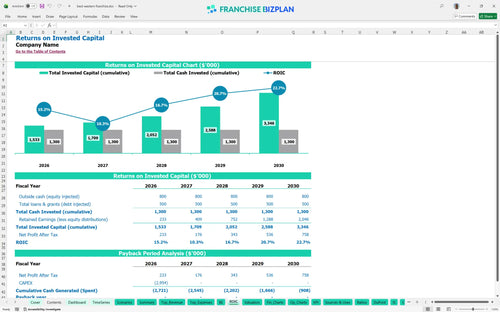
The investment offers a 1.72% IRR and a 2.56 ROE, but full payback only occurs after the fifth year of operation. To be fair, knowing how to calculate ROI for a hotel franchise is essential when analyzing hotel franchise investment viability.
The unit breaks even in April 2026, driven primarily by room revenue and strategic corporate contracts. Honestly, speed to break-even is the best hedge against market volatility when you learn how to estimate hotel franchise operating costs.
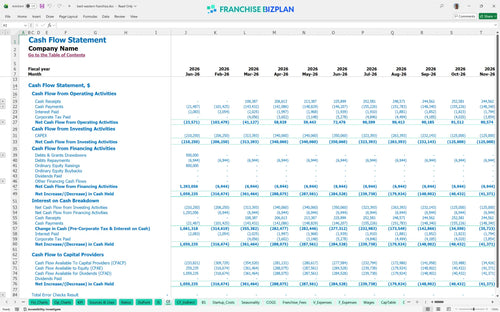
Anyway, the lowest cash point is -$1,169,000 in December 2026, requiring a significant initial liquidity buffer to survive the ramp-up. Cash is oxygen, and you will need a full tank for the first year, so use this franchise unit cash flow projection template wisely.
High-performance scenarios significantly improve the 1.72% IRR by optimizing RevPAR and labor efficiency across the five-year forecast. Creating a financial forecast for hospitality business owners helps you sleep at night by preparing for the worst.
This hotel franchise financial model is built in Excel, meaning you can tweak every variable from room rates to laundry costs. The formulas are pre-set, so you just plug in your specific location data to see how local demand affects your bottom line. It is a financial model template for midscale hotel franchise owners who need a tool for real-world planning, not just a static spreadsheet.

So, mapping out five years of hospitality franchise financial projection data helps you see past the initial opening chaos. We track revenue growth from $2.37M in year one up to $3.63M by year five, giving you a clear view of how a franchise profitability analysis scales over time. This long-term view is vital for securing financing and planning your exit strategy.

Still, this model accounts for the 5% franchise royalty fees and 2% marketing fund contributions that come right off the top of your gross sales. By modeling these as a percentage of revenue, you can see exactly how much cash stays in the unit after the brand takes its cut. It is the only way to understand your true store-level margin.

Use this franchise startup cost template to track the $2.95M+ needed for build-out, furniture, and technology. We calculate the exact point where your room revenue covers both fixed property leases and variable guest supplies, which is vital when estimating startup costs for airport hotel franchise locations. Knowing your break-even point helps you manage stress during those first few months.

We have baked in best practices for hotel franchise financial planning by including industry standards for things like linen laundry and guest amenities. If your labor costs or utilities drift too far from these benchmarks, the model flags it so you can adjust your hotel business plan Excel assumptions. It is like having a CFO looking over your shoulder.


Simply purchase and download the financial model template, then access it instantly using Microsoft Excel or Google Sheets. No installation or technical expertise required-just open and start working.

Enter your business-specific numbers, including revenue projections, costs, and investment details. The pre-built formulas will automatically calculate financial insights, saving you time and effort.

Leverage the investor-ready format to confidently showcase your financial projections to banks, franchise representatives, or investors. Impress stakeholders with clear, data-driven insights and professional reports.

Leverage the investor-ready format to confidently present your projections to banks, franchise representatives, or investors.