
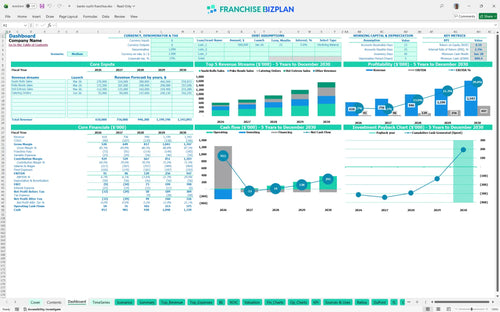
All-in-one Dashboard
Core inputs and core outputs


This restaurant franchise unit profitability model includes a full suite of Excel-based tools to project revenue, manage expenses, and calculate total ROI for a single-unit sushi operation.
Core inputs and core outputs
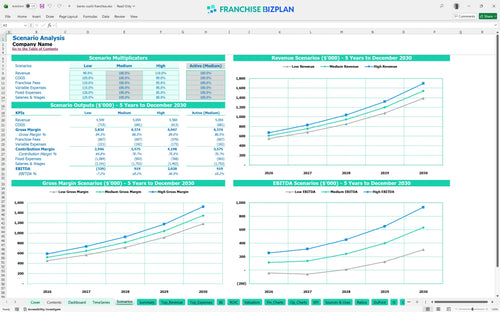
Three scenario analysis
Presentation ready
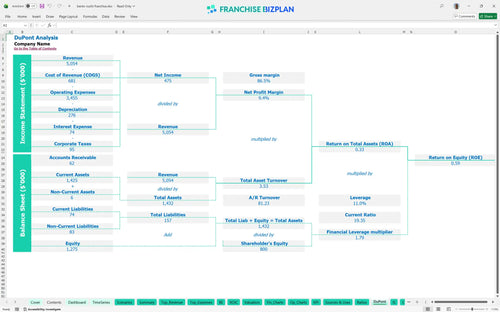
DuPont analysis
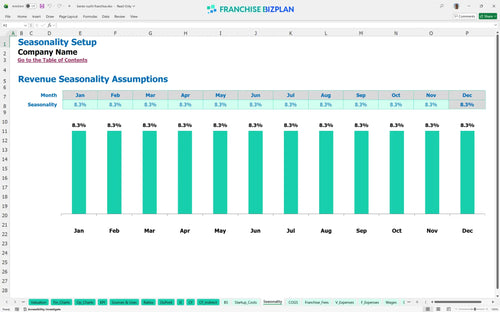
Researched revenue assumptions
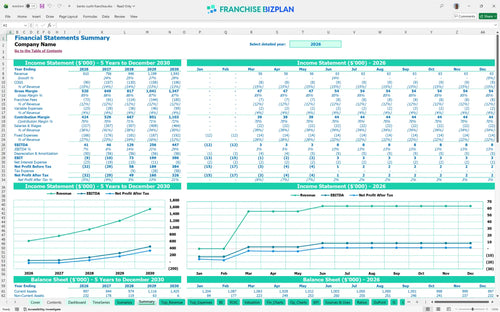
Lender-friendly financial outputs
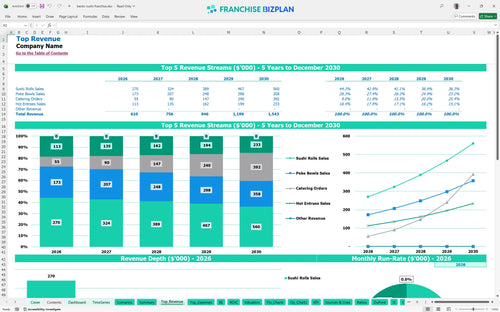
Revenue stream detailed view
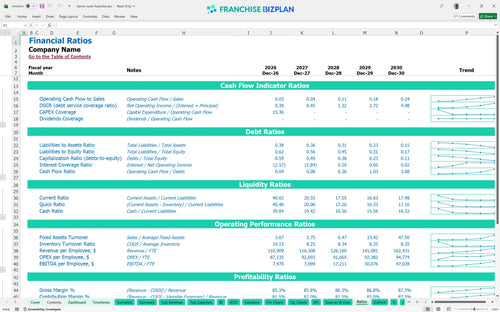
Performance metrics benchmark
We built this financial planning for sushi franchise owners using deep research into the brand unit economics. Key assumptions like the $9,000 monthly rent and the 10% royalty fee are pre-populated but fully editable. With a year-one revenue target of $610,000 and a 5-year payback period, this model gives you a data-driven look at the actual cash requirements for a flagship mall location.
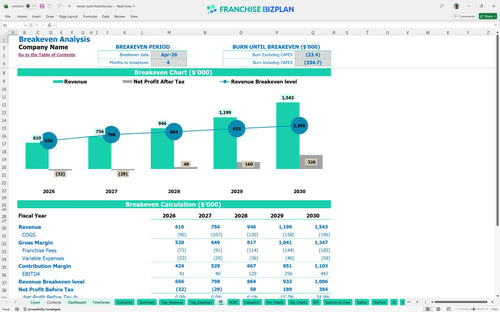
This unit hits profitability fast, with a break-even date of April 2026, just four months after launch. While year one EBITDA is a modest $41,000, it scales significantly to $447,000 by year five as B2B catering revenue forecasting for restaurant franchises kicks in and operations mature.
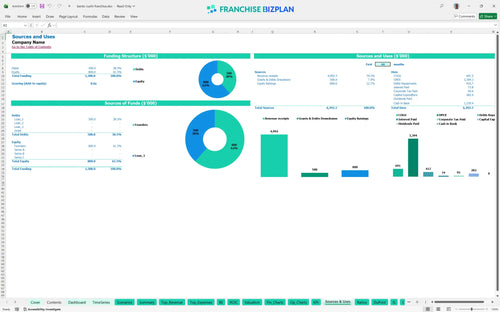
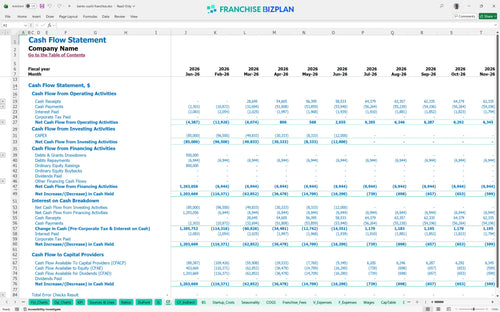
To get the doors open in the US, you will need a total initial investment of $282,000. This covers everything from the $30,000 franchise fee to kitchen equipment and signage. You will also want to watch your minimum cash, which defintely dips to $899,000 in early 2028 due to scaling costs and franchise capital requirements.
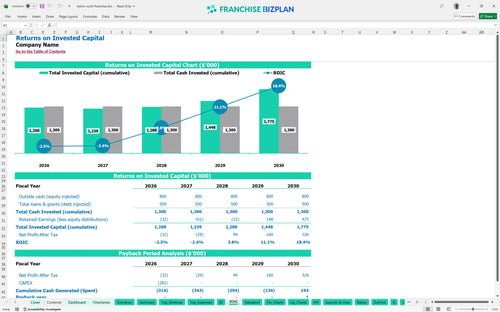
For those wondering how to evaluate a franchise opportunity financial model, the metrics here show a steady climb. You are looking at an IRR of 2.35% and a 5-year payback period. While the initial return on equity is 0.59, the long-term value lies in the $1.5M revenue potential and franchise ROI estimation by year five.
You need to reach break-even by month 4 to stay on track with the April 2026 target. The biggest driver here is the $9,000 monthly rent at the mall location. If throughput during the lunch rush stays high, you will cover those fixed costs easily, but labor management is the real lever for daily profit.
The lowest cash point hits in January 2028, so you need enough runway to handle the ramp-up. Even with $610,000 in year-one sales, projecting labor and food costs for a sushi franchise accurately is the only way to protect your buffer. If catering orders lag, you will need to tighten the belt on non-essential spend.
A 10% drop in revenue can push your payback out by a year, while the High Case sees EBITDA explode past the $447,000 mark. The model shows that Year-1 margins are sensitive to the 12.5% seafood cost; keeping that tight is the difference between a good year and a great one. Finance: update unit break-even and payback model by Friday.
This franchise financial model template is built for real-world use in Excel, letting you tweak every variable to fit your specific market. You can adjust pre-filled formulas and editable assumptions to see how a different zip code or higher labor rate changes your bottom line. It is an Excel template for franchise business financial forecasting that moves with your decisions, not a static PDF, making it a vital part of your restaurant franchise business plan.

Planning a unit level financial projection requires looking past the grand opening. This model provides a detailed 5-year view of revenue, costs, and cash flow to help you see the path from a $610,000 year-one start to a $1.5M mature operation. It gives you the quick service restaurant financials needed to talk to lenders or partners with confidence using a franchise unit revenue projection spreadsheet.

Royalties and brand funds are the franchise tax that can eat your margin if you do not plan for them. This template for estimating franchise royalty and marketing fees automatically calculates the 10% royalty and 2% marketing fund against your gross sales. It ensures your operating expense forecasting is accurate so you know exactly how much goes to the franchisor before you pay your own light bill.

Use this franchise startup cost calculator to map out the $282,000 initial investment, from the $30,000 franchise fee to the $110,000 in leasehold improvements. Knowing your break-even sales estimates is vital; for this model, hitting that point in month 4 is the goal. It provides a clear startup cost breakdown for quick service franchise units and explains how to calculate franchise startup costs for a restaurant without the guesswork.

Do not guess on your fast casual restaurant profit analysis. The model includes built-in franchise and industry benchmarks for key operating and financial metrics to help you sanity-check your numbers. If your seafood and fresh ingredients costs are way off the 12.5% starting point, you will know your restaurant unit economics need a closer look before you sign that lease.


Simply purchase and download the financial model template, then access it instantly using Microsoft Excel or Google Sheets. No installation or technical expertise required-just open and start working.

Enter your business-specific numbers, including revenue projections, costs, and investment details. The pre-built formulas will automatically calculate financial insights, saving you time and effort.

Leverage the investor-ready format to confidently showcase your financial projections to banks, franchise representatives, or investors. Impress stakeholders with clear, data-driven insights and professional reports.

Leverage the investor-ready format to confidently present your projections to banks, franchise representatives, or investors.