


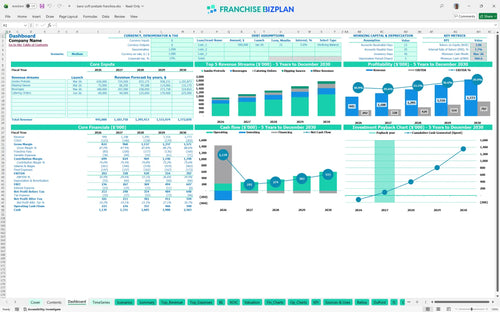
All-in-one Dashboard
Core inputs and core outputs



This pre-written excel model for franchise business planning includes dynamic revenue streams, detailed labor schedules, and automated cash flow statements for a turnkey unit.
Core inputs and core outputs
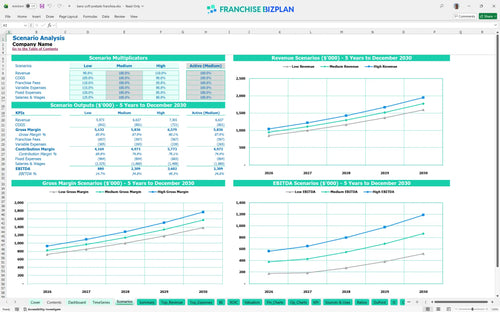
Three scenario analysis
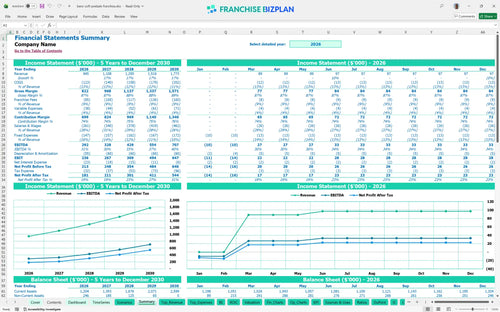
Presentation ready
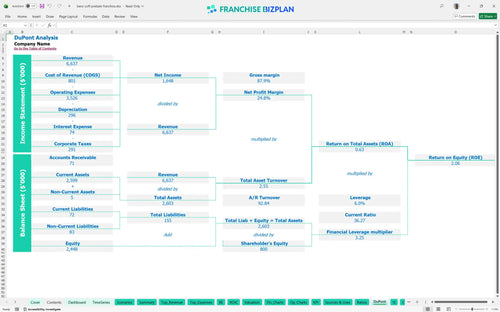
DuPont analysis
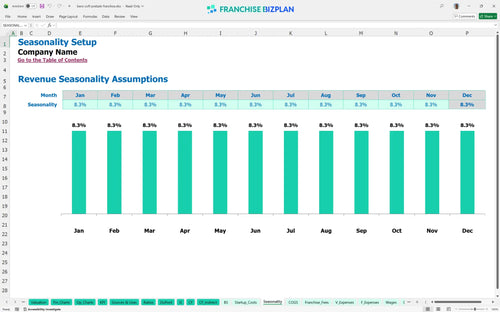
Researched revenue assumptions
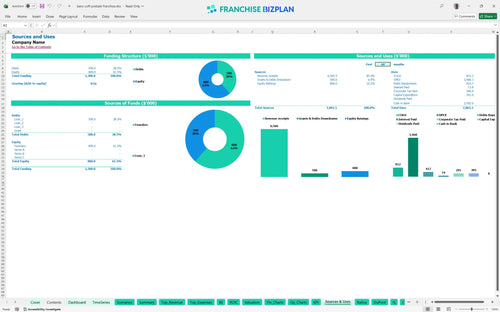
Lender-friendly financial outputs
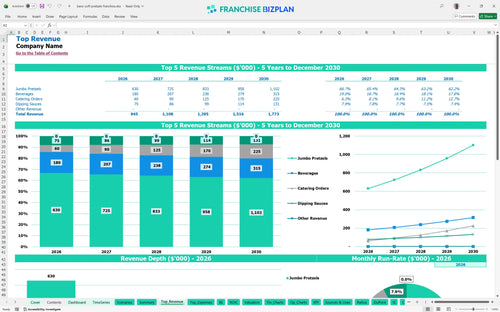
Revenue stream detailed view
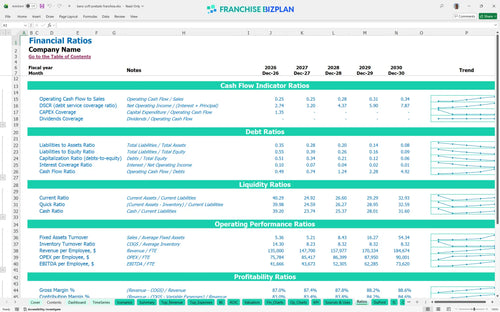
Performance metrics benchmark
We built this restaurant franchise business plan using deep-dive research into high-traffic snack concepts. Key assumptions like the $945,000 Year 1 revenue and the $8,500 monthly rent are pre-populated but defintely easy to edit. This model provides financial planning for new franchise owners who need to see how $301,000 in startup capital translates into a 2-year payback.
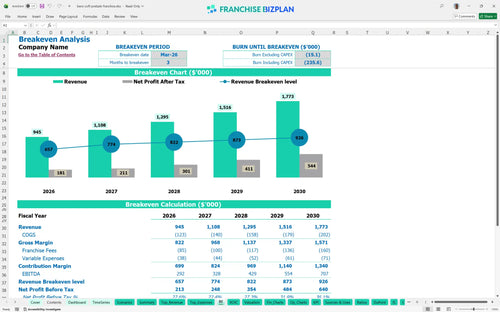
The unit hits its stride quickly, with a break-even date of March 2026, just three months after opening. Estimating profitability for a quick-service restaurant is simpler when you see that Year 1 EBITDA reaches $292,000 after all royalties and labor costs. By Year 5, the model projects EBITDA to grow to $707,000 as catering and beverage sales scale.
You will need approximately $301,000 to get the doors open, which is the core of how to calculate startup costs for a food franchise. This total includes the $31,000 franchise fee, $120,000 for leasehold improvements, and $65,000 for baking equipment. The model also accounts for a $967,000 minimum cash balance to ensure you have a massive safety net during the first quarter.
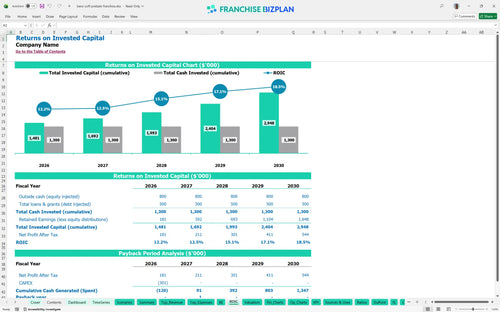
Investors can expect an internal rate of return (IRR) of 7.72% and a full payback on the initial investment within 2 years. The model shows a Return on Equity (ROE) of 2.06, which is a strong indicator of how efficiently the unit generates profit from your initial $301,000 outlay. These metrics provide a clear picture for any multi-unit operator looking to scale.
You reach break-even in March 2026, requiring enough volume to cover $12,700 in monthly fixed costs plus your 9% total franchise and marketing fees. The main driver is throughput, specifically moving jumbo pretzels and beverages during peak event windows. If labor or rent costs spike, the model shows how many extra pretzels you must sell to stay in the black.
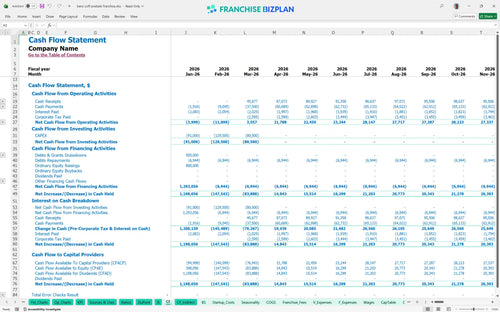
The lowest cash point occurs in March 2026 at $967,000, assuming you start with the recommended liquidity. This franchise location financial performance tracker shows that since break-even happens in month 3, the runway risk is relatively low. Still, you must manage the timing of your $65,000 equipment payment and $120,000 build-out costs to avoid a crunch.
Analyzing food franchise revenue streams across different cases shows that a 10% drop in traffic can delay your 2-year payback. The high case is heavily influenced by catering, which is projected to grow from $60,000 in Year 1 to $225,000 by Year 5. If you hit these high-volume targets, your Year 5 EBITDA could exceed the $707,000 baseline significantly.
This franchise financial model template is built in Excel, allowing you to swap out every assumption from dough costs to local labor rates. It uses pre-filled formulas so you can test different scenarios without breaking the math. It is an essential Excel template for franchise financial projections that adapts to your specific site needs.

Map out your growth with a food service franchise financial forecast that spans 60 months. It tracks how catering orders and jumbo pretzel sales scale from Year 1 at $945,000 to Year 5 at $1,773,000. This franchise profit and loss projection helps you see the long-term impact of annual rent escalations and labor shifts.

Managing franchise royalty and operating costs is easier when the 7% royalty and 2% marketing fund are baked into the P&L. This tool ensures you see the real unit economics after the franchisor takes their cut. It simplifies tracking ongoing franchise royalty fees and brand fund contributions against your monthly gross sales.

Use the franchise startup cost calculator to estimate the $301,000 initial outlay required for this concept. It includes everything from the $31,000 franchise fee to $120,000 in leasehold improvements for your storefront. The break-even analysis shows exactly when your daily pretzel volume covers your fixed operating expenses.

We included benchmarks for labor and occupancy to help you spot margin leaks in your franchise unit operational budget spreadsheet. If your rent exceeds the $8,500 monthly estimate, the model shows how that pressure affects your restaurant franchise investment return calculator. It is a reality check for your store-level margins.


Simply purchase and download the financial model template, then access it instantly using Microsoft Excel or Google Sheets. No installation or technical expertise required-just open and start working.

Enter your business-specific numbers, including revenue projections, costs, and investment details. The pre-built formulas will automatically calculate financial insights, saving you time and effort.

Leverage the investor-ready format to confidently showcase your financial projections to banks, franchise representatives, or investors. Impress stakeholders with clear, data-driven insights and professional reports.

Leverage the investor-ready format to confidently present your projections to banks, franchise representatives, or investors.