
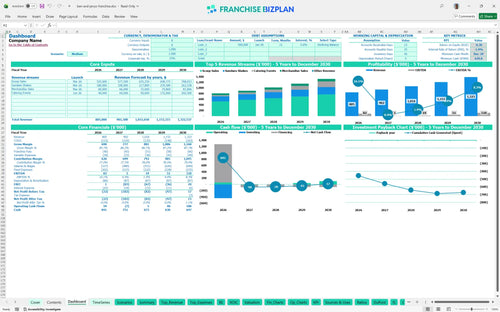
All-in-one Dashboard
Core inputs and core outputs


This franchise unit financial model template provides a complete Excel-based toolkit for forecasting revenue, expenses, and cash flow for a premium dessert shop.
Core inputs and core outputs
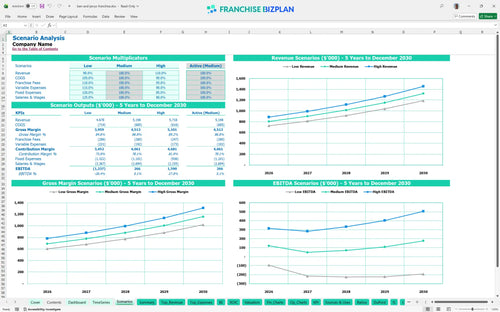
Three scenario analysis
Presentation ready
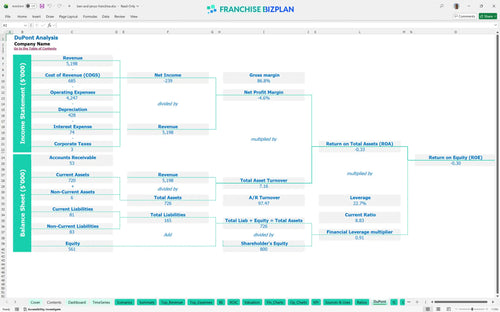
DuPont analysis
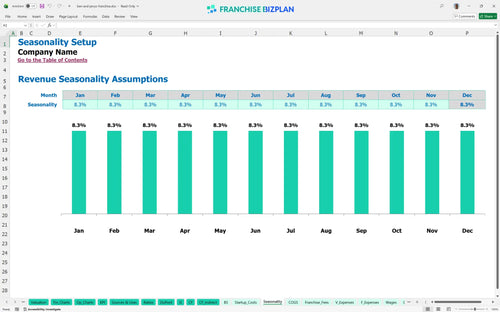
Researched revenue assumptions
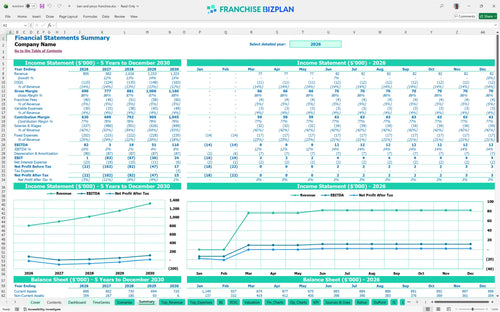
Lender-friendly financial outputs
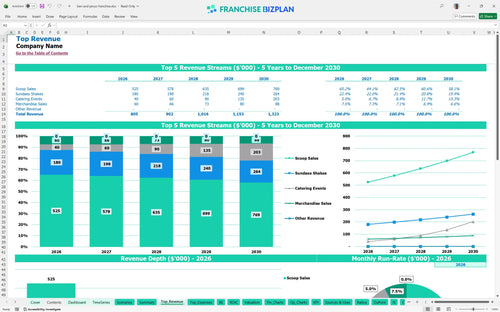
Revenue stream detailed view
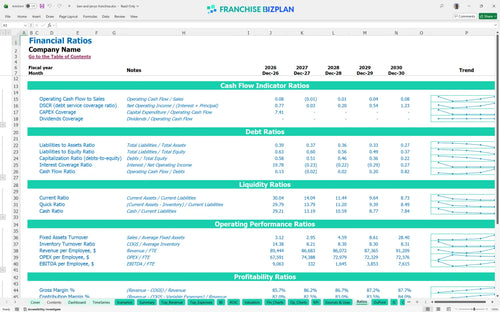
Performance metrics benchmark
We built this franchise unit financial model using our own research into the premium dessert sector to ensure every assumption is grounded in reality. The model comes pre-populated with editable data for scoop sales, catering events, and royalties, reflecting a Year 1 revenue target of $805,000. It serves as a comprehensive franchise investment calculator that you can adapt to your specific location and local labor market.
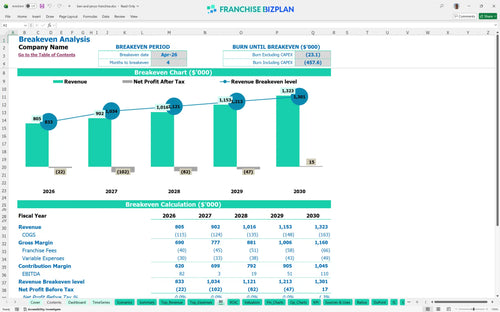
The unit reaches operational breakeven quickly in April 2026, just four months after launch, but bottom-line EBITDA fluctuates significantly in the early years. To analyze profitability for a new franchise location, you must look past the $82,000 Year 1 EBITDA and prepare for tighter margins as staffing scales up in Year 2. Profitability stabilizes by Year 5 with an expected EBITDA of $110,000 as catering revenue grows to $202,500.
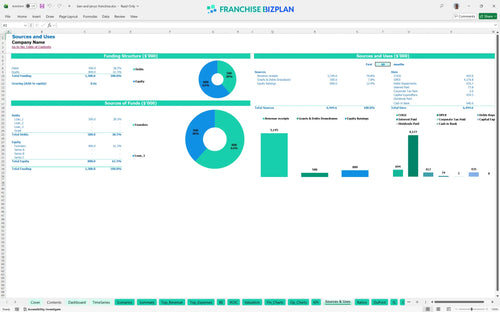
You will need approximately $434,500 in total capital to cover the initial franchise fee and physical build-out of the shop. This franchise investment feasibility study template shows that the bulk of your funds go toward leasehold improvements and essential refrigeration equipment. Here is the quick math: you need a solid cash reserve because the model shows a minimum cash point of $630,000 later in the cycle.
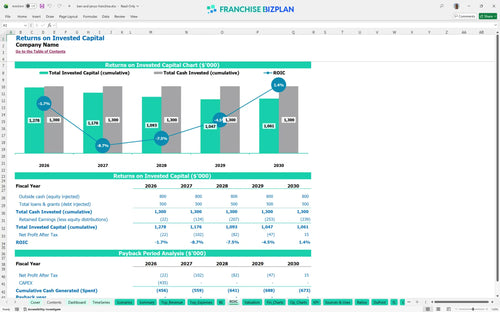
The franchise ROI for this specific model shows a long-term play, with a payback period extending beyond the initial five-year window. With an IRR of -1.91% and a Year 5 net margin of roughly 8.3%, this is a lifestyle business or a strategic territory play rather than a rapid cash-out. What this estimate hides is the potential resale value of the unit once revenue crosses the $1.3M mark in Year 5.
Using this small business financial projection excel template, we see the unit hits its break-even date in April 2026. The primary driver for reaching this point is the $12,000 monthly rent and the high labor cost for a fully staffed shop. To stay above water, you need to maintain high throughput and leverage the $350,000 in base scoop sales during the first year of operation.
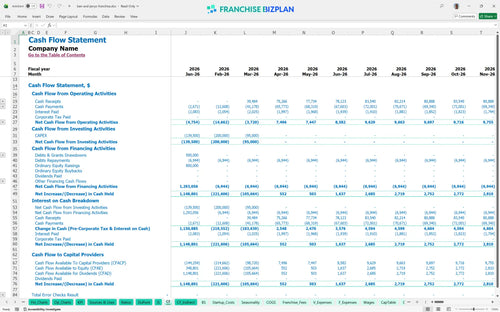
The retail store monthly cash flow projection spreadsheet indicates the lowest cash point occurs in December 2029 at $630,000. While the unit is operational, the timing of capital reinvestment and staffing increases means you need a healthy buffer to survive seasonal dips. Still, the cash flow remains positive enough to avoid additional debt if you manage your $14,400 annual insurance costs and utilities tightly.
Applying best practices for franchise unit financial forecasting means looking at how a 10% revenue drop or a spike in COGS impacts your $82,000 Year 1 EBITDA. In a high-growth scenario where catering hits its targets early, the year-5 margin can expand significantly beyond the base 8.3%. However, if labor costs for your 8.5 FTE crew members rise faster than prices, your peak cash need will increase defintely.
This franchise financial model template is built in Excel with fully editable assumptions, allowing you to plug in your specific territory data and local market variables. You can adjust everything from scoop prices to seasonal traffic patterns, and the pre-filled formulas instantly update your entire ice cream shop business plan. It is a flexible tool designed to handle the moving parts of a retail operation without needing a degree in finance.

Planning for long-term success requires more than a one-year snapshot, so this model provides a detailed 5-year outlook for your unit. By using this financial model template for retail store franchise planning, you can track how revenue scales from $805,000 in year one to over $1.3 million by year five. It gives you a clear view of the long-term profitability analysis and cash flow needs as the business matures.

The model simplifies estimating operating costs for a dessert shop franchise by hard-coding the specific 3% royalty and 2% marketing fund contributions. These fees are calculated automatically against your gross sales, ensuring you see the true net impact on your store-level margin. It defintely helps you understand the ongoing cost of brand support and how it scales with your volume.

Calculating franchise unit startup costs is the first hurdle for any new owner, and this tool breaks down the $434,500 initial investment into clear categories. You can perform a detailed break-even analysis to see exactly when your monthly sales will cover your $12,000 rent and other fixed overhead. This clarity is vital for managing your early-stage working capital and setting realistic performance targets.

We have integrated retail franchise profitability analysis benchmarks to help you sanity-check your labor and occupancy costs against industry standards. By comparing your projected franchise unit performance metrics to these baselines, you can identify if your $1.8k monthly utility bill or staffing levels are out of alignment. It is like having a financial planning guide for new franchise owners built right into your spreadsheet.


Simply purchase and download the financial model template, then access it instantly using Microsoft Excel or Google Sheets. No installation or technical expertise required-just open and start working.

Enter your business-specific numbers, including revenue projections, costs, and investment details. The pre-built formulas will automatically calculate financial insights, saving you time and effort.

Leverage the investor-ready format to confidently showcase your financial projections to banks, franchise representatives, or investors. Impress stakeholders with clear, data-driven insights and professional reports.

Leverage the investor-ready format to confidently present your projections to banks, franchise representatives, or investors.