
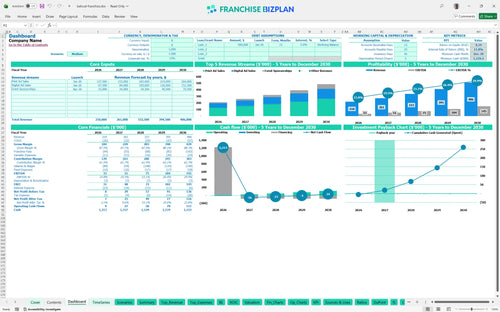
All-in-one Dashboard
Core inputs and core outputs


This financial model template for advertising-based franchises provides a comprehensive toolkit for projecting revenue, managing high-margin digital sales, and tracking the 2-year payback period for a new territory.
Core inputs and core outputs
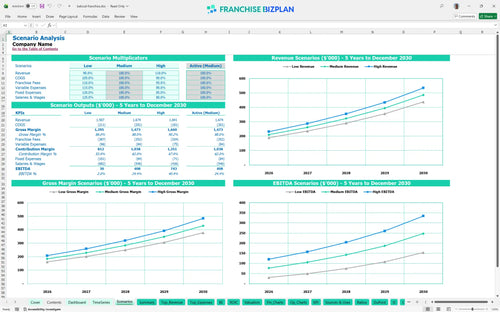
Three scenario analysis
Presentation ready
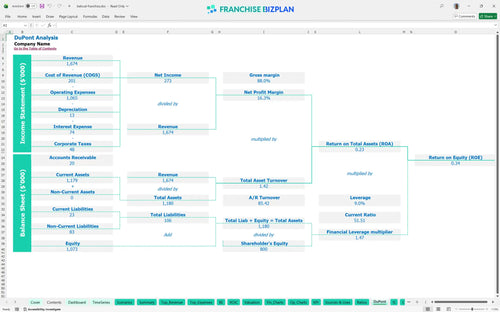
DuPont analysis
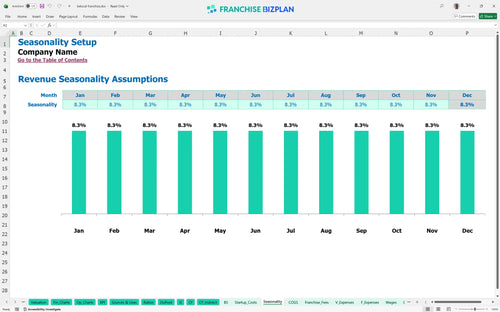
Researched revenue assumptions
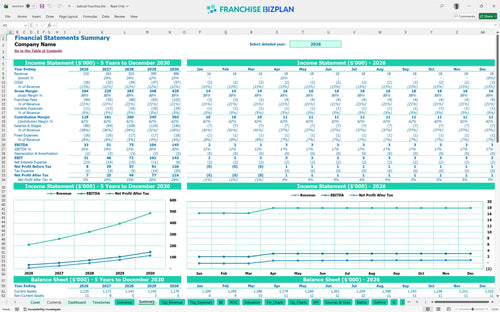
Lender-friendly financial outputs
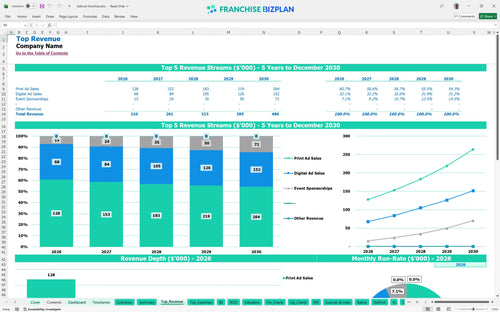
Revenue stream detailed view
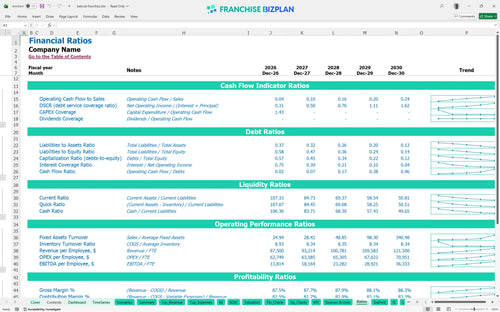
Performance metrics benchmark
We developed this local media franchise financial model based on extensive research into territory-based advertising units. The pre-populated data includes revenue streams like print ad sales starting at $85,000 and digital sales at $45,000, alongside operating expenses and a 6% royalty fee, all of which you can edit to fit your specific market needs.
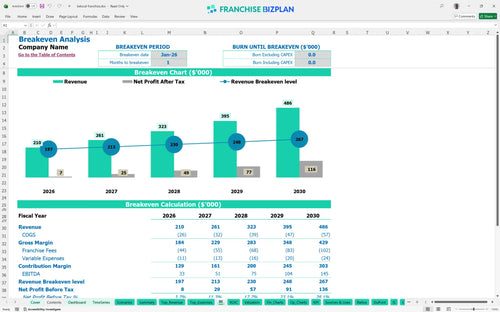
This franchise profitability calculator shows the unit becomes profitable in its first year, generating $33,000 in EBITDA. As revenue scales from $210,000 to $486,000 over five years, the net profit grows significantly because fixed costs like the $420 rent and $150 software subscriptions stay relatively flat while sales volume increases.
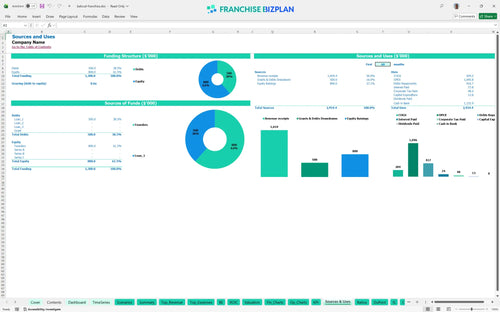
To learn how to calculate startup costs for a franchise unit, look at the startup cost breakdown for local media franchise territory which totals approximately $12,835 for initial CAPEX. This includes a $735 franchise fee, $2,800 for computer equipment, and $2,200 for website development, plus a small cash buffer for the first month of operations.
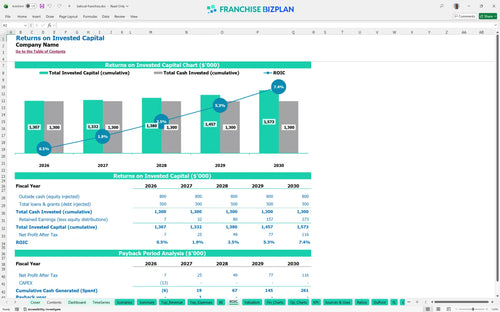
Evaluating franchise investment ROI spreadsheet data reveals an Internal Rate of Return (IRR) of 11.85% and a Return on Equity (ROE) of 0.34. This franchise investment analysis tool estimates a 2-year payback period, meaning you recover your initial $12,835 investment relatively quickly compared to brick-and-mortar concepts with higher build-out costs.
The franchise unit budget template for new owners indicates a break-even point in just 1 month, primarily because the fixed overhead is so low. With monthly fixed expenses totaling roughly $1,320 and a high gross margin on digital sales, reaching the break-even analysis threshold depends mostly on securing your first few anchor advertisers.
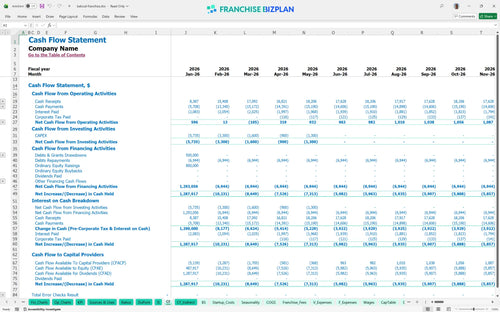
Using this Excel template for franchise unit cash flow forecasting, the lowest cash point is projected at $1,119,000 in December 2029, suggesting the business is highly cash-generative. Still, you should maintain a small buffer to handle the timing gap between paying commissions and receiving advertiser payments, especially since marketing fees are 15% of gross sales.
Estimating profitability for local media franchise businesses requires looking at different outcomes; a high-growth scenario could see revenue hit $486,000 faster if digital ad sales exceed the $101,000 year-5 forecast. If sales are slow, the 15% marketing fee and 6% royalty still apply, so maintaining a high average ticket is vital to protecting your year-1 margin.
This franchise financial model template is built in Excel with fully editable assumptions, allowing you to tweak every driver from ad sales volume to local labor rates. You can adjust the pre-filled formulas to match your specific territory's market density, ensuring the projections reflect your actual operating environment rather than just a generic estimate.

Success in local media requires a long-term view, and this franchise business plan template maps out your journey from a $210,000 first year to a projected $486,000 in annual revenue by year five. The model tracks how your EBITDA scales from $33,000 to $145,000 as you build brand equity and advertiser retention in your exclusive territory.

Financial planning for print and digital advertising franchises requires a deep dive into fee structures that impact your bottom line. This tool helps with understanding franchise royalty and fee structures in excel by modeling the 6% royalty and the 15% marketing fund contribution, ensuring you see the exact impact of these costs on your monthly store-level margin.

Before you sign a lease or hire a sales team, use this franchise startup costs spreadsheet to quantify your total initial investment and monthly burn. The model provides a clear break-even analysis, showing you exactly how many print and digital ad units you need to sell each month to cover your fixed costs like the $420 monthly co-working rent.

This franchise unit performance tracking spreadsheet includes researched benchmarks for labor, printing, and distribution costs to keep your projections grounded in reality. By comparing your $35,000 sales manager salary or 9.5% printing cost against industry norms, you can defintely spot where your model might be too aggressive or where you have room to optimize.


Simply purchase and download the financial model template, then access it instantly using Microsoft Excel or Google Sheets. No installation or technical expertise required-just open and start working.

Enter your business-specific numbers, including revenue projections, costs, and investment details. The pre-built formulas will automatically calculate financial insights, saving you time and effort.

Leverage the investor-ready format to confidently showcase your financial projections to banks, franchise representatives, or investors. Impress stakeholders with clear, data-driven insights and professional reports.

Leverage the investor-ready format to confidently present your projections to banks, franchise representatives, or investors.