
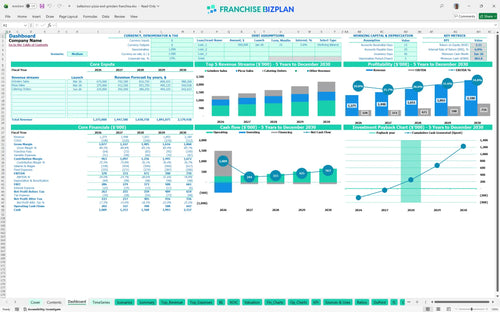
All-in-one Dashboard
Core inputs and core outputs


This pizza shop financial model excel template provides a comprehensive financial projection model for quick service restaurants, covering everything from initial CAPEX to five-year cash flow maturity.
Core inputs and core outputs
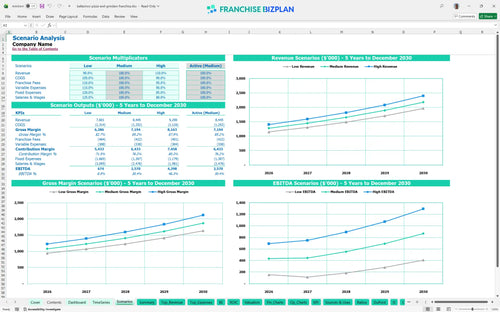
Three scenario analysis
Presentation ready
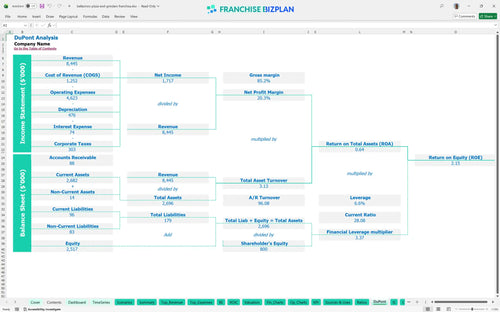
DuPont analysis
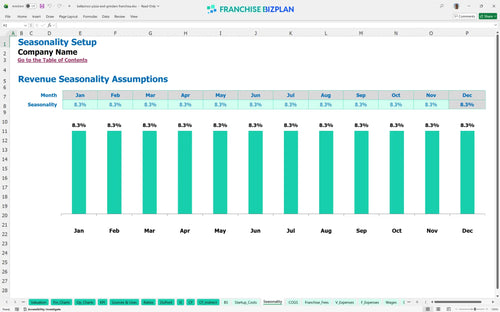
Researched revenue assumptions
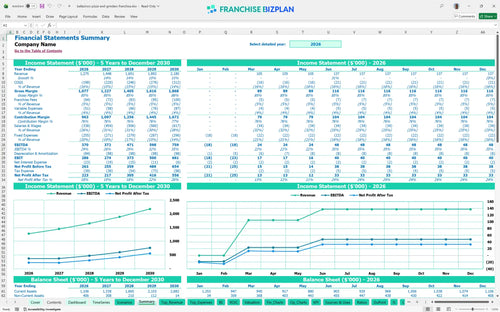
Lender-friendly financial outputs
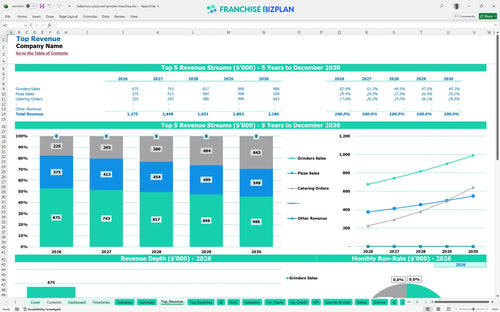
Revenue stream detailed view
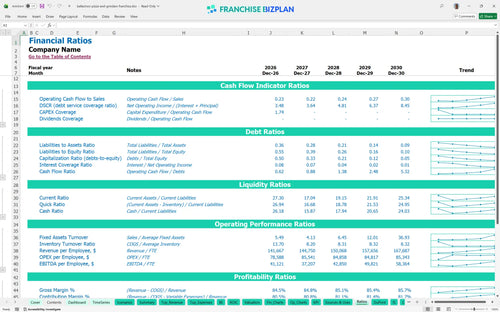
Performance metrics benchmark
We developed this franchise unit financial model using detailed research into the pizza and grinder fast-casual sector. Key assumptions, including the $16,000 monthly rent and $1.27M initial revenue target, are pre-populated with researched data and remain fully editable for your specific location. This tool allows you to evaluate franchise investment opportunities with precision, focusing on real-world unit economics and throughput.
Profitability begins in Year 1 with a projected EBITDA of $370,000. Here's the quick math: by Year 3, revenue scales to $1.65M as catering orders grow to $253,500, helping offset the $16,000 monthly rent and fixed overhead.
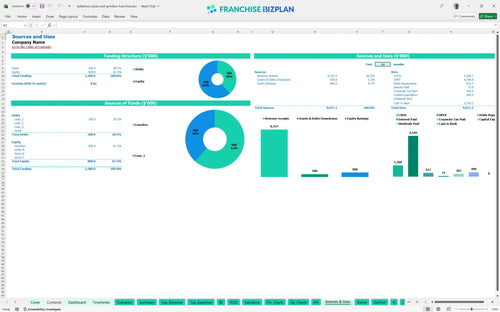
You need approximately $490,000 in total startup capital requirements for equipment and build-out, plus the $35,000 initial franchise fee. The largest allocation goes toward $220,000 in leasehold improvements and $90,000 for specialized pizza and bread baking ovens.
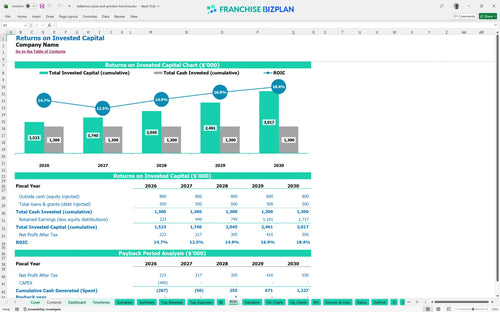
This restaurant ROI analysis shows a 3-year payback period and an Internal Rate of Return (IRR) of 5.98%. While the initial Return on Equity is 2.15, the model projects Year 5 EBITDA to reach $759,000 as the unit matures and gains local density.
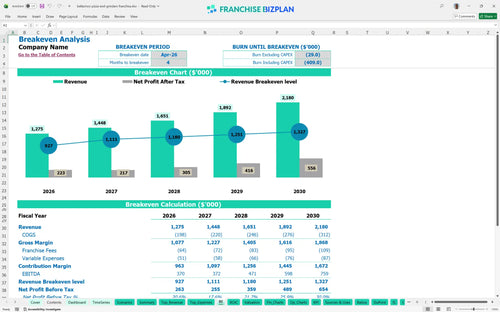
You defintely need to hit the break-even point by April 2026, which is month 4 of operations. The primary driver is the $16,000 monthly rent; you must maintain high daily traffic and a strong average ticket to cover these high fixed occupancy costs.
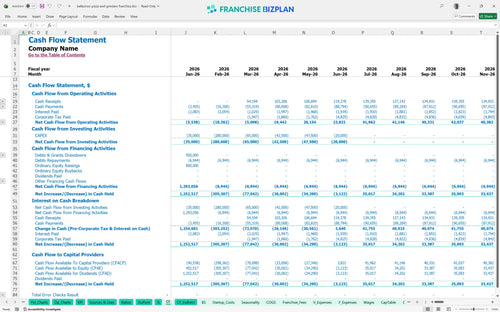
The lowest cash point is $803,000 in June 2026, indicating you need a solid cash buffer during the first six months. Financial forecasting for new franchise owners shows that managing the timing of the $25,000 POS system and $20,000 signage is critical for maintaining liquidity.
A restaurant franchise unit profitability analysis reveals that a 'High' scenario, driven by superior local marketing, can push Year 1 revenue well above $1.27M. However, a 'Low' scenario with a 10% revenue dip significantly delays the 3-year payback due to the fixed $16,000 rent burden.
This franchise unit financial model is fully customizable in Excel, featuring pre-filled formulas and editable assumptions for a complete pizza franchise business plan. You can easily adjust the revenue drivers, local labor rates, and rent to fit your specific territory or site selection needs.

Plan for long-term growth with a food service financial projection that tracks your trajectory from $1.27M in year one to $2.18M by year five. This model provides a clear profit and loss statement and cash flow view to help you manage a single unit or a small franchise chain effectively.

Understanding franchise royalty and marketing fees is vital for maintaining store-level margin in a high-volume environment. This model specifically captures the 4% royalty and 1% marketing fund contributions, ensuring you know exactly how these obligations impact your monthly bottom line.

Learning how to calculate startup costs for a pizza franchise is simplified with our structured breakdown of the $35,000 franchise fee and $220,000 build-out. The model identifies your break-even sales level, helping you plan for the initial ramp-up and monthly fixed cost coverage.

The model incorporates restaurant franchise startup costs and operating expenses for restaurants based on researched industry standards. Use these benchmarks to sanity-check your food ingredient costs, which are modeled to start at 13.5% and improve as you optimize operations.


Simply purchase and download the financial model template, then access it instantly using Microsoft Excel or Google Sheets. No installation or technical expertise required-just open and start working.

Enter your business-specific numbers, including revenue projections, costs, and investment details. The pre-built formulas will automatically calculate financial insights, saving you time and effort.

Leverage the investor-ready format to confidently showcase your financial projections to banks, franchise representatives, or investors. Impress stakeholders with clear, data-driven insights and professional reports.

Leverage the investor-ready format to confidently present your projections to banks, franchise representatives, or investors.