
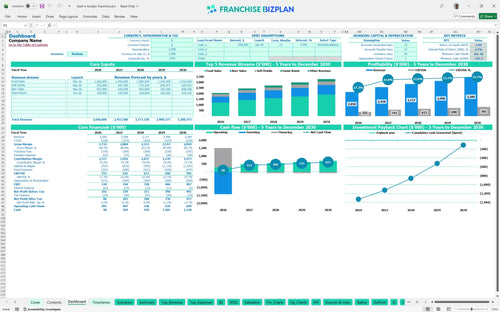
All-in-one Dashboard
Core inputs and core outputs


This tool provides a complete roadmap for your unit's financial journey from pre-opening through five years of operations, including detailed CAPEX and payroll tracking.
Core inputs and core outputs
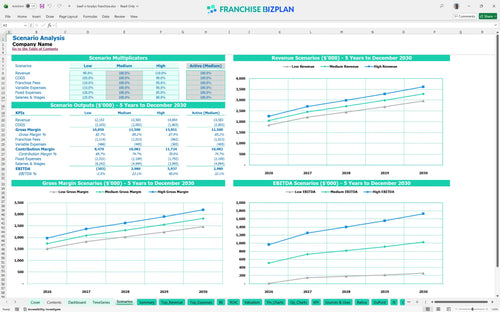
Three scenario analysis
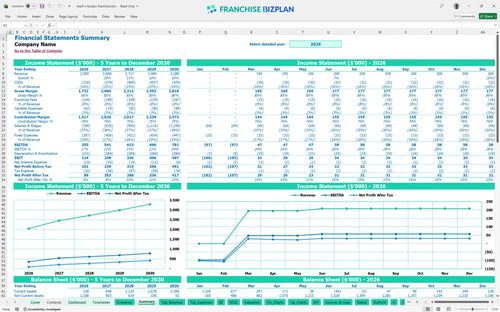
Presentation ready
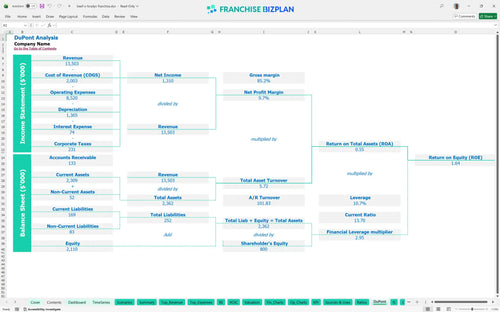
DuPont analysis
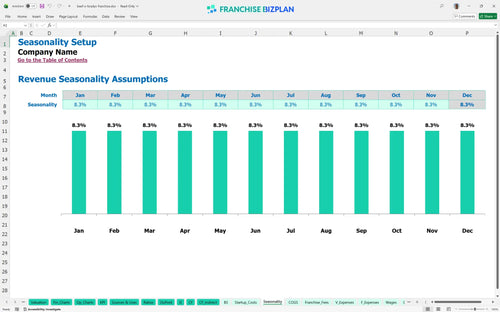
Researched revenue assumptions
Lender-friendly financial outputs
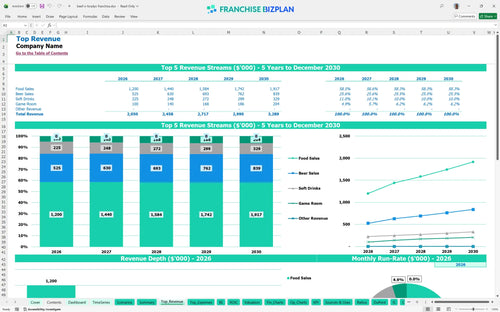
Revenue stream detailed view
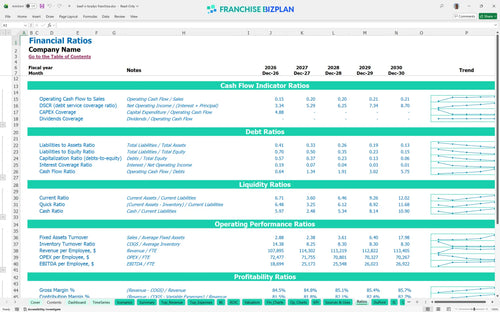
Performance metrics benchmark
We built this franchise unit financial model using our own research to give you a realistic starting point for your investment. Key assumptions like the $2,050,000 year-one revenue and $355,000 EBITDA (earnings before interest, taxes, depreciation, and amortization) are pre-populated and fully editable. You can adjust every line item to match your specific location and local labor market needs.
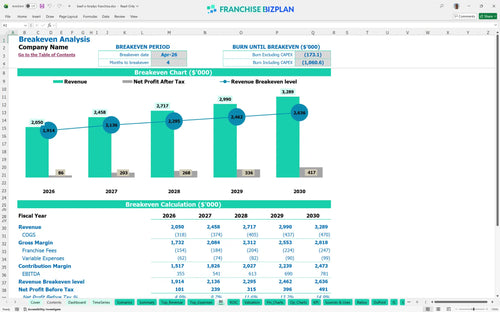
This financial model for family-friendly restaurant franchise shows the unit reaching its break-even point in April 2026. After accounting for COGS (cost of goods sold), 5% royalties, and fixed costs like the $20,000 monthly rent, you will defintely see positive net profit by the fourth month of operation. Financial planning for new restaurant franchise location starts with understanding this speed to profit.
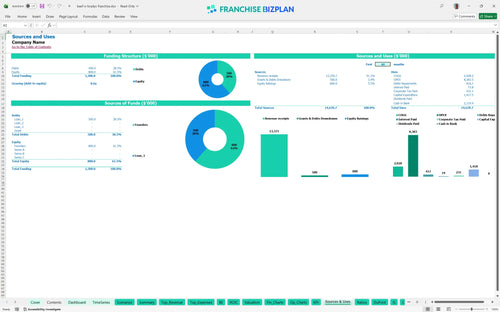
You need about $1.4M to launch, including a $37,500 franchise fee and $600,000 for leasehold improvements. Learning how to calculate startup costs for a sports bar franchise is easier when you see the capital expenditure forecast (long-term asset spending) laid out by category. The model accounts for everything from $220,000 in kitchen gear to $110,000 for the game room.
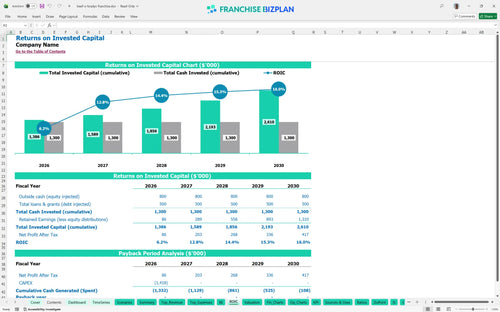
Based on the ROI analysis (return on investment), this unit delivers an IRR (internal rate of return) of 2.14% and a 1.64 return on equity. While the payback period extends past year 5, the EBITDA grows to $781,000 by year five, showing strong long-term cash flow. How to analyze franchise investment profitability depends on looking at these multi-year trends rather than just year one.
To hit break-even in month 4, you need to cover about $33,000 in monthly fixed costs, including rent and utilities. This spreadsheet for franchise unit operational budget shows that food sales are your biggest driver, but beer sales provide the margin cushion. Here's the quick math: your break-even point calculation depends heavily on maintaining a 12.5% food cost.
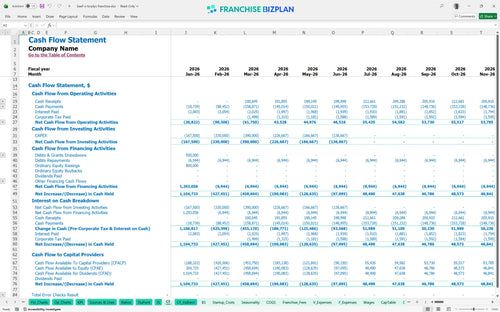
Your lowest cash point is -$197,000 in June 2026, which means you need a solid working capital buffer. This franchise unit cash flow projection spreadsheet helps you track the timing gaps between your $1.4M build-out and the ramp-up of your $2M plus in annual sales. What this estimate hides is the potential for construction delays, so keep extra cash ready.
Using this Excel template for restaurant franchise financial forecasting, you can toggle between Low, Medium, and High revenue cases. If you hit the High case with $3.2M in sales by year 5, your ROI improves significantly. Restaurant franchise revenue forecasting tools allow you to see how a 10% drop in traffic might delay your payback or increase your peak cash need.
This franchise financial model template is built in Excel with fully editable assumptions. You can adjust revenue drivers, staffing levels, and operating expenses (costs to run the business) to fit your specific territory. Every cell is open, so you can change the math to match your real-world local market conditions and labor rates.

Building a restaurant franchise business plan requires long-term visibility into your cash flow. This tool provides detailed 5-year franchise unit financial projections, covering everything from initial launch to mature-unit performance. It helps you see how annual sales growth impacts your bottom line over the long haul, ensuring you plan for scale from day one.

Understanding your royalty fee structure is vital because these costs come off the top of your revenue. This model tracks the 5% royalty and 2.5% marketing fund contributions, helping you with evaluating franchise royalty and marketing fee impacts on your store-level margin. It ensures you know exactly how much goes to the franchisor every month before you pay your own bills.

Use this franchise startup cost calculator to map out your total initial investment before you sign a lease. It includes a detailed break-even point calculation to show you the exact sales volume needed to cover your $20,000 monthly rent and other fixed costs. Knowing your floor helps you manage risk during the early months of the operation.

This model includes restaurant profitability analysis tools to compare your unit against industry standards. By estimating labor costs for restaurant franchise operations using built-in benchmarks, you can see if your staffing plan is too heavy or too lean. It is a sanity check to ensure your projections stay within a realistic range for the casual dining sector.


Simply purchase and download the financial model template, then access it instantly using Microsoft Excel or Google Sheets. No installation or technical expertise required-just open and start working.

Enter your business-specific numbers, including revenue projections, costs, and investment details. The pre-built formulas will automatically calculate financial insights, saving you time and effort.

Leverage the investor-ready format to confidently showcase your financial projections to banks, franchise representatives, or investors. Impress stakeholders with clear, data-driven insights and professional reports.

Leverage the investor-ready format to confidently present your projections to banks, franchise representatives, or investors.