
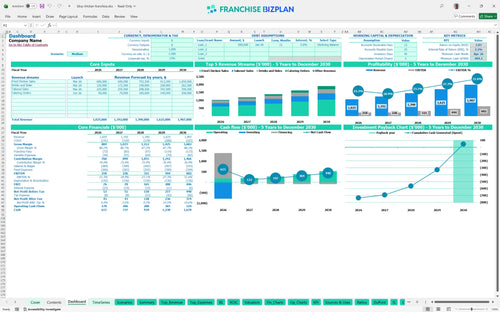
All-in-one Dashboard
Core inputs and core outputs


This restaurant franchise P&L statement template includes a complete financial model for chicken restaurant startup operations, featuring automated CAPEX schedules, 5-year projections, and detailed cash flow tracking.
Core inputs and core outputs
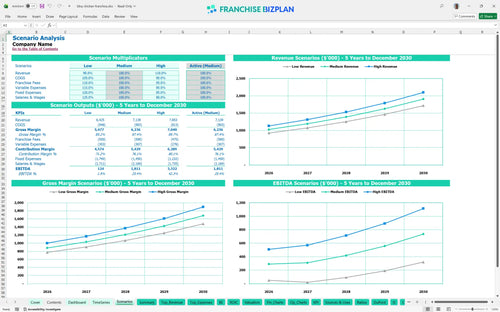
Three scenario analysis
Presentation ready
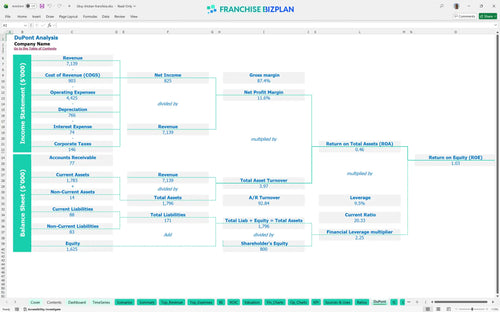
DuPont analysis
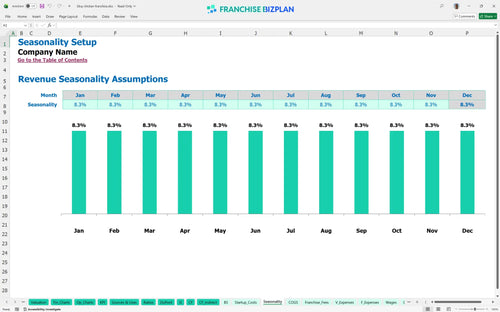
Researched revenue assumptions
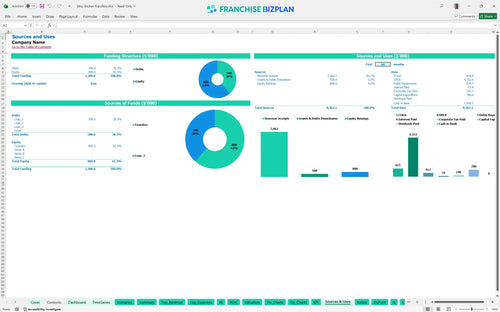
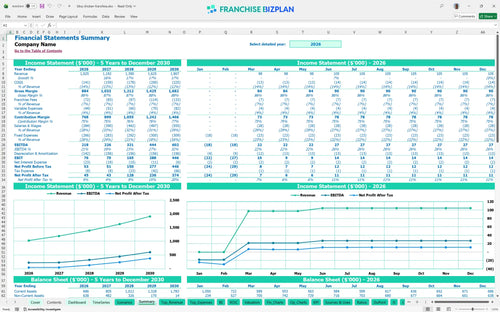
Lender-friendly financial outputs
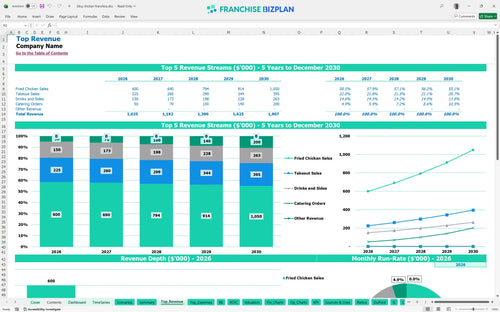
Revenue stream detailed view
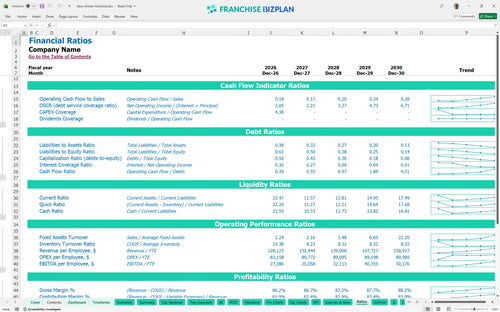
Performance metrics benchmark
We built this financial model for chicken restaurant startup units using our own research into the fried chicken sector. Key assumptions like the $1,025,000 year-one revenue and the $780,000 total build-out are pre-populated with researched data specific to this franchise unit and are fully editable. It provides a clear path for evaluating franchise investment opportunities with confidence.
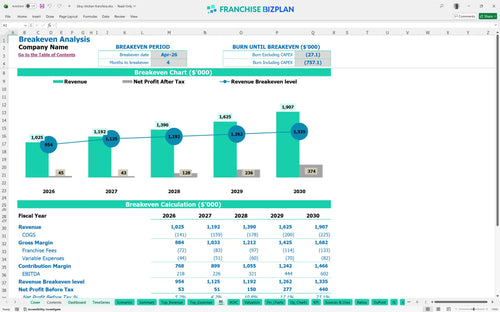
This franchise unit is projected to reach monthly profitability by April 2026, just four months after the initial launch. By calculating net profit after the 5% royalty, 2% marketing fund, and $16,000 monthly rent, the model shows EBITDA growing from $218,000 in year one to $602,000 by year five. Speed to profit depends on hitting your $400,000 year-one fried chicken sales target. Efficiency in the kitchen is the engine of your bottom line.
To launch this unit in the US, you need a startup budget for new restaurant location costs totaling $780,000. This capital expenditure budget covers the $45,000 franchise fee, $350,000 for leasehold improvements, and $180,000 for specialized kitchen equipment like fryers and prep stations. The model ensures you have the cash to build a flagship-quality space in a prime corridor. Capital is your fuel; don't run out before you open.
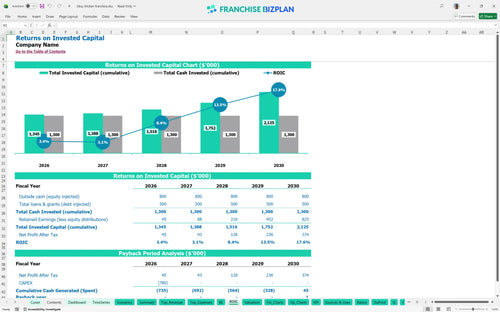
Investors can expect a 5-year payback period and an internal rate of return (IRR) of 2.19% based on the current projections. While the initial ROI calculation might seem modest, the return on equity (ROE) of 1.03 and the steady climb in annual revenue to $1.9 million by year five show strong long-term value. Calculating revenue streams for food service franchise units accurately is vital for setting realistic exit expectations. Real wealth in franchising is built through multi-unit consistency.
The franchise unit performance modeling tool identifies the break-even date as April 2026. To cover the $16,000 monthly rent and $2,200 in utilities, the unit must maintain high throughput, particularly in the takeout and delivery segments which account for $150,000 in year-one sales. Labor is the most sensitive variable; even a small spike in crew hours can push your break-even point further out. Volume is the only cure for high fixed costs.
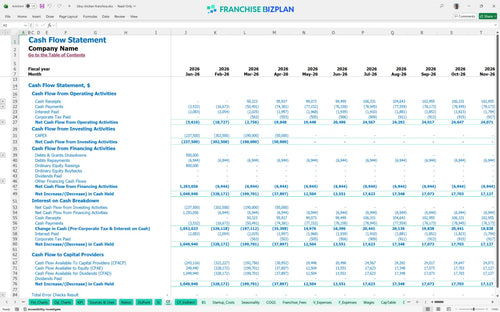
The lowest cash point occurs in April 2026, with a minimum cash balance of $484,000. This means you need a significant cash buffer to survive the build-out and the first few months of operations before the $1,025,000 in annual revenue fully ramps up. If construction takes 60 days longer than planned, your working capital pressure will rise significantly. Cash is king, but cash flow is the whole kingdom.
The model allows for analyzing operational costs for franchise business scenarios by comparing Low, Medium, and High cases. A 'High' case, driven by aggressive local marketing and catering reaching $200,000 by year five, significantly improves the IRR and shortens the payback. Conversely, the 'Low' case shows how a 10% dip in fried chicken sales can delay breakeven and increase peak cash needs during the first year. Stress-testing your assumptions is the only way to prepare for a downturn.
Finance: update unit break-even and payback model by Friday
This franchise financial model template is a defintely flexible tool built in Excel, allowing you to swap out every assumption to match your specific territory. It features pre-filled formulas and editable inputs for things like local labor rates and rent escalations, making it easy to adapt to your specific operating scenario. You can adjust the variables without worrying about breaking the underlying logic. One clean model saves you dozens of hours of manual entry.

Planning for long-term growth requires more than just a gut feeling; you need a restaurant business plan Excel tool that looks five years into the future. This model provides detailed revenue, cost, and cash flow projections so you can see the trajectory of a single unit or a small chain. It helps you visualize when the store moves from the initial ramp-up phase into mature-unit profitability. Long-term success is about seeing the hurdles before you hit them.

Franchise-specific costs like the 5% royalty and 2% marketing fund contribution can eat into your margins if you don't track them correctly. This model simplifies analyzing operational costs for franchise business units by automating these calculations against your gross sales. You will see exactly how much cash stays in the store after all brand obligations are met. Knowing your true net after royalties is the difference between profit and a surprise loss.

Understanding how to calculate startup costs for a restaurant franchise is the first step to securing funding. We map out the total $780,000 initial investment, including everything from the $45,000 franchise fee to the $350,000 leasehold improvements. The built-in break-even analysis then shows you the exact sales volume needed to cover your $16,000 monthly rent and other fixed costs. Every dollar of initial spend is tracked against your eventual payback.

We've integrated restaurant unit economics benchmarks to help you sanity-check your numbers against industry standards. This includes estimating labor costs for fast-casual dining and comparing your gross margins to typical ranges for high-volume chicken concepts. If your food costs are trending higher than the 12% benchmark, the model flags it so you can take action. Benchmarks keep your projections grounded in the reality of the current market.


Simply purchase and download the financial model template, then access it instantly using Microsoft Excel or Google Sheets. No installation or technical expertise required-just open and start working.

Enter your business-specific numbers, including revenue projections, costs, and investment details. The pre-built formulas will automatically calculate financial insights, saving you time and effort.

Leverage the investor-ready format to confidently showcase your financial projections to banks, franchise representatives, or investors. Impress stakeholders with clear, data-driven insights and professional reports.

Leverage the investor-ready format to confidently present your projections to banks, franchise representatives, or investors.