
All-in-one Dashboard
Core inputs and core outputs


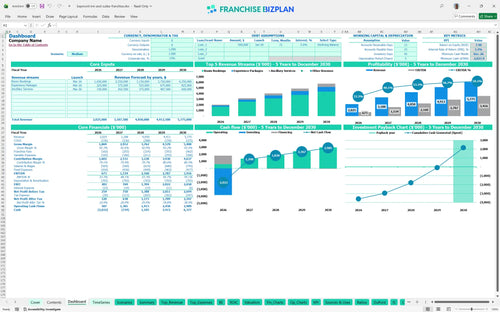
This franchise unit financial forecasting for hospitality investors includes everything from CAPEX scheduling for digital concierge tech to a full 5-year EBITDA projection starting at $673,000.
Core inputs and core outputs
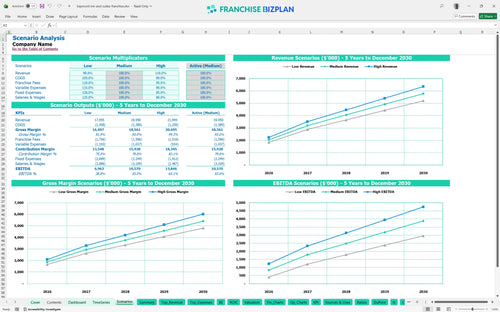
Three scenario analysis
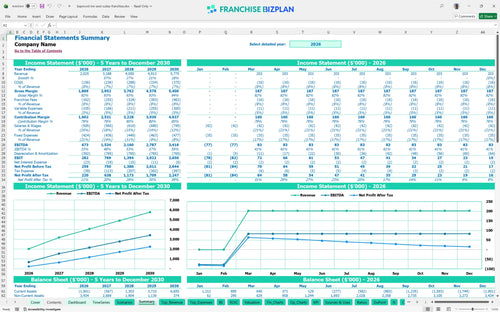
Presentation ready
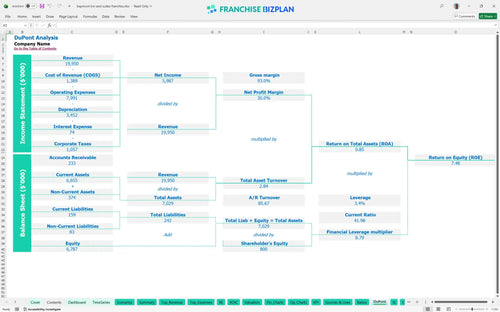
DuPont analysis
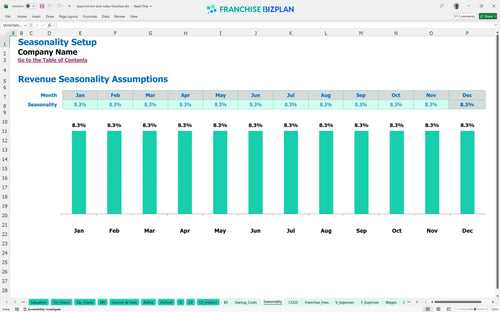
Researched revenue assumptions
Lender-friendly financial outputs
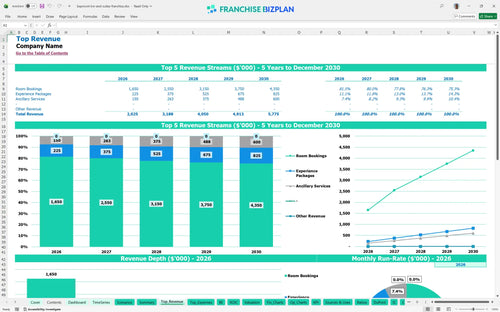
Revenue stream detailed view
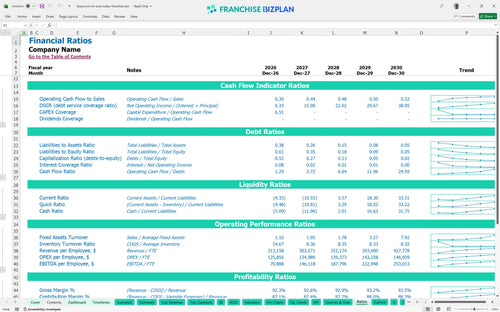
Performance metrics benchmark
We built this financial model template for midscale hotel ownership using deep research into hospitality performance. Key assumptions like the $26,000 franchise fee and $90,000 general manager salary are pre-populated but fully editable to reflect your specific market. With a year-one revenue target of $2,025,000, this model helps you track the path to a 7.48% return on equity.
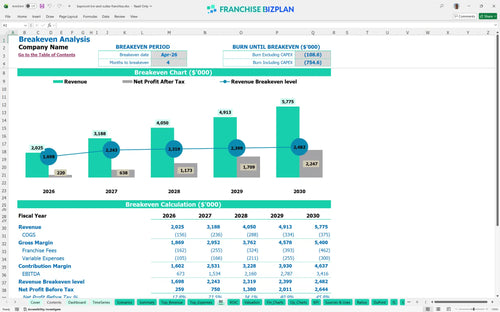
You can expect to hit the break-even point by April 2026, just four months after launching. While year one shows an EBITDA of $673,000, true net profitability scales as you move toward the $3,416,000 EBITDA projected for year five. This hotel profitability analysis tool makes the trajectory clear.
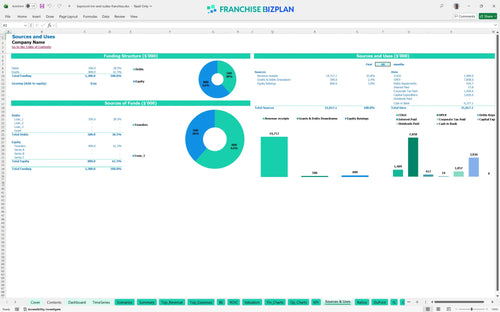
Launching this unit requires significant upfront capital, primarily for the $1,800,000 in leasehold improvements and $1,200,000 for furniture and equipment. When you add the $26,000 franchise fee and $250,000 for the property management system, your total initial investment is substantial, leading to a minimum cash low point of -$2,022,000. This is a core part of your hospitality capital expenditure budget.
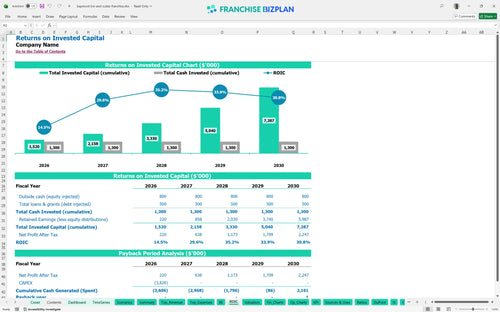
Analyzing return on investment for hotel franchise units shows an internal rate of return (IRR) of 3.25% and a return on equity (ROE) of 7.48%. The payback period is estimated at 5 years, which is typical for a heavy CAPEX hospitality investment. This franchise ROI projection helps set realistic expectations for your partners.
The monthly break-even occurs in April 2026, driven by the $1,100,000 in room bookings needed to cover the $22,000 monthly rent and fixed labor costs. Maintaining a high average ticket on experience packages defintely helps hit this milestone faster. Estimating operating expenses for a new hotel franchise is critical to finding this number.
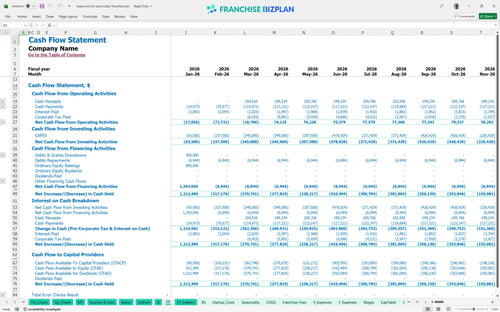
Your lowest cash point is -$2,022,000 in December 2026, reflecting the heavy initial build-out and ramp-up phase. You'll need a robust franchise unit cash flow statement to cover the gap before the unit generates enough cash flow to self-sustain. Knowing how to create a cash flow projection for a hotel business prevents mid-project funding gaps.
A franchise investment feasibility study spreadsheet must account for volatility. High-performing units hitting the $5,775,000 revenue mark see massive EBITDA growth, while low-revenue scenarios might extend the 5-year payback period and increase the peak cash need. Use this hotel business plan financial projections template to test your downside risk.
This hotel franchise financial model is built in Excel, allowing you to swap out every assumption from room rates to local labor costs. The pre-filled formulas handle the heavy lifting, so you can test different occupancy levels or seasonal demand shifts without breaking the math. It is a flexible franchise investment calculator designed for real-world hospitality scenarios.

Mapping out a long-term hospitality business financial template is essential for securing debt or equity. This tool provides a 60-month view of your income statement and cash flow, helping you see how scaling from $2,025,000 in year one to $5,775,000 in year five impacts your bottom line. It provides the clarity needed for a professional franchise business plan template.

Operating a branded unit means managing specific financial obligations like the 5% royalty and 3% marketing fund. This model tracks these fees against your room bookings and ancillary services to ensure you know exactly how much goes to the brand and what stays in your pocket. It simplifies the hotel franchise profitability analysis spreadsheet by automating fee calculations.

Use this franchise startup cost spreadsheet to budget for the $1,800,000 leasehold improvements and $1,200,000 in furniture and equipment. By identifying your fixed costs like the $22,000 monthly rent, you can pinpoint the exact occupancy needed to reach the break-even date. Knowing how to calculate startup costs for a hotel franchise is the first step toward a stable operation.

We include benchmarks for midscale hospitality to help you sanity-check your hotel operating expense breakdown. For instance, if your housekeeping supplies exceed the 3.5% benchmark or your breakfast ingredients deviate from the 4.2% starting point, the model flags it so you can adjust. These are the best financial planning tools for hotel franchise owners looking for precision.


Simply purchase and download the financial model template, then access it instantly using Microsoft Excel or Google Sheets. No installation or technical expertise required-just open and start working.

Enter your business-specific numbers, including revenue projections, costs, and investment details. The pre-built formulas will automatically calculate financial insights, saving you time and effort.

Leverage the investor-ready format to confidently showcase your financial projections to banks, franchise representatives, or investors. Impress stakeholders with clear, data-driven insights and professional reports.

Leverage the investor-ready format to confidently present your projections to banks, franchise representatives, or investors.