
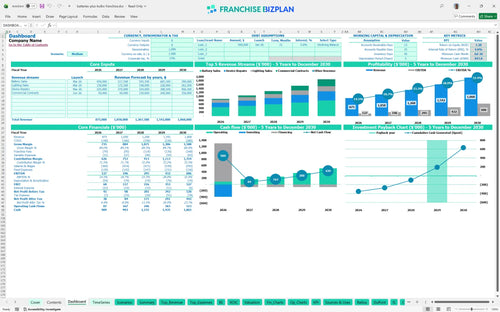
All-in-one Dashboard
Core inputs and core outputs


This Excel financial template for new franchise owners includes everything from capital expenditure planning and payroll forecasting to a complete 5-year P&L and cash flow statement for a franchise profitability spreadsheet.
Core inputs and core outputs
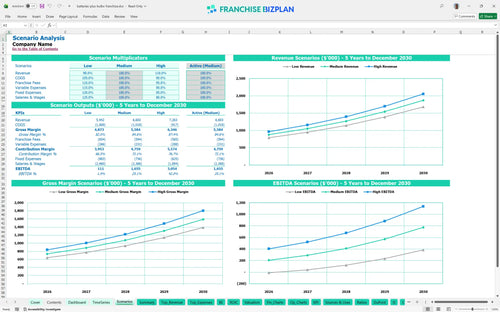
Three scenario analysis
Presentation ready
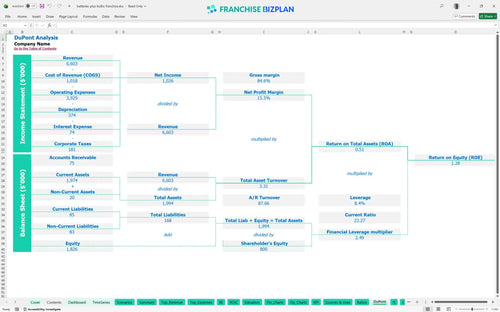
DuPont analysis
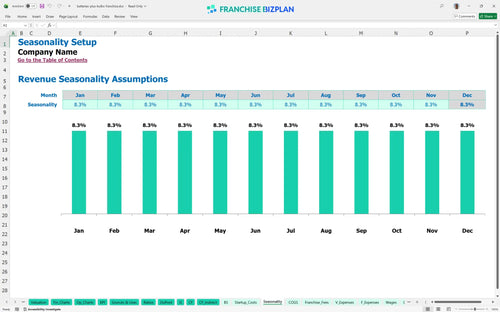
Researched revenue assumptions
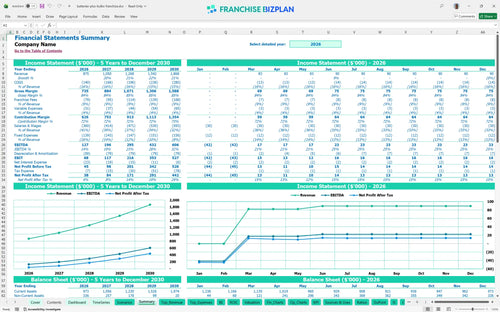
Lender-friendly financial outputs
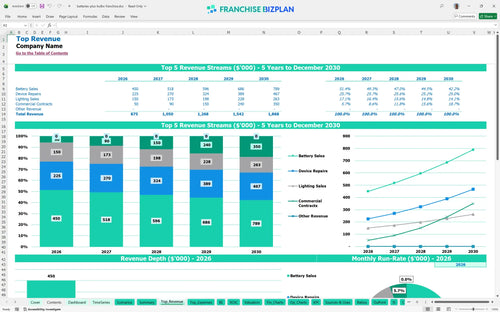
Revenue stream detailed view
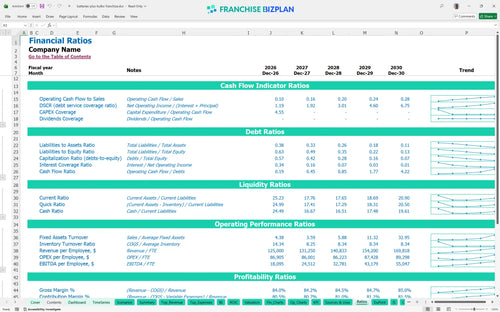
Performance metrics benchmark
We built this franchise unit financial model using deep research into the specialty power and repair sector. Key assumptions for revenue streams like device repairs and commercial contracts, plus costs like the $7,500 monthly rent, are pre-populated and ready for you to customize. With a projected year one EBITDA of $127,000, this tool helps you validate if the model fits your local market.
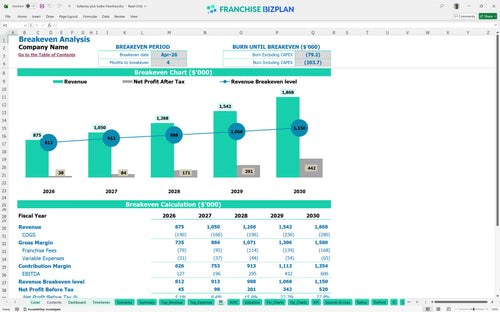
Your unit is projected to hit its break-even date in April 2026, just four months after launching. This franchise unit financial performance assessment shows that by year two, EBITDA should climb to $196,000 as commercial contracts and repeat battery sales start to provide a more stable revenue base.
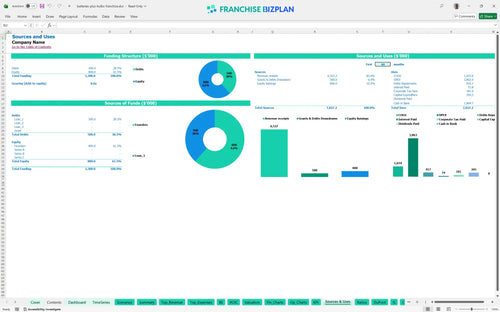
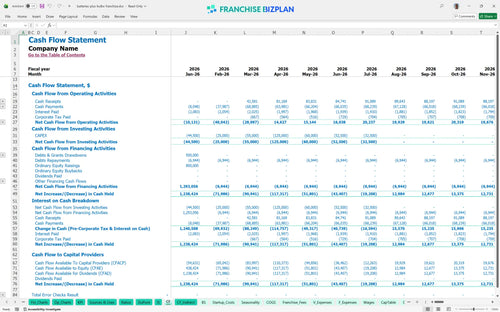
Launching this unit requires significant upfront liquidity, with the model showing a minimum cash need of $844,000 by July 2026 to handle the ramp-up. This covers the initial $44,500 franchise fee, the $70,000 mobile repair vehicle, and $150,000 in leasehold improvements to ensure the store meets brand standards.
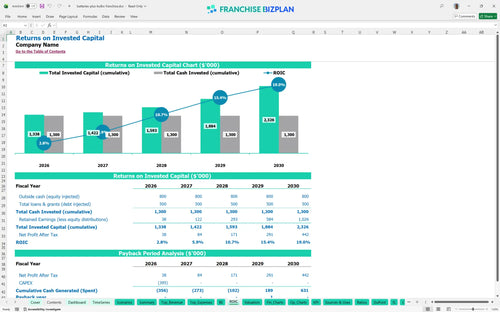
For this specific unit, the model estimates a 4-year payback period and an internal rate of return (IRR) of 3.97%. While the initial years focus on recovering the heavy CAPEX, the ROE of 1.28 indicates steady equity growth as the store matures, making the franchise ROI calculation favorable for long-term holders.
You need to reach break-even within 4 months to stay on track with the model's projections. When preparing a business plan for a retail franchise location, remember that the biggest hurdle is the fixed cost load, led by $7,500 in rent and a robust staffing plan that includes a store manager and multiple technicians.
The lowest cash point occurs in July 2026, so you need enough working capital to bridge the gap between opening and full maturity. If commercial contract signings lag by even 60 days, the pressure on your cash buffer will increase significantly, so keep an eye on your cash runway.
Predicting profitability for mobile service franchises requires looking at Low, Medium, and High cases. A High scenario, where revenue hits the $1.8M mark early, drastically improves your IRR, while a Low case might extend your payback period beyond the 4-year mark in this spreadsheet template for franchise investment analysis.
Finance: update unit break-even and payback model by Friday.
This franchise financial model template is built in Excel, allowing you to tweak every variable from battery inventory turnover to mobile repair labor. You can edit pre-filled formulas to match your specific territory's rent or local wage laws, making it a flexible tool for any retail franchise business plan.

Plan for long-term growth with a full 5-year outlook covering revenue, expenses, and store-level EBITDA. By mapping out year-over-year growth-like the jump from $875,000 in year one to over $1.8 million by year five-you can defintely visualize the scaling potential of financial forecasting for multi-revenue stream franchises using this small business accounting template.

Operating a franchise means managing ongoing obligations like a 5% royalty and a 4% marketing fund. This model calculates these costs automatically based on your gross sales, ensuring your franchise unit economics stay accurate as you scale your B2B contract revenue modeling for franchises.

Use this franchise startup cost calculator to figure out how to calculate startup costs for a retail franchise without the guesswork. Between the $44,500 initial fee and $150,000 in leasehold improvements, you need to know exactly when your monthly margins will cover these fixed costs.

We've baked in essential financial metrics for franchise operators to help you sanity-check your numbers against industry standards. Whether you are estimating operational costs for mobile repair services or conducting an operating expense analysis, these benchmarks ensure your projections aren't just wishful thinking.


Simply purchase and download the financial model template, then access it instantly using Microsoft Excel or Google Sheets. No installation or technical expertise required-just open and start working.

Enter your business-specific numbers, including revenue projections, costs, and investment details. The pre-built formulas will automatically calculate financial insights, saving you time and effort.

Leverage the investor-ready format to confidently showcase your financial projections to banks, franchise representatives, or investors. Impress stakeholders with clear, data-driven insights and professional reports.

Leverage the investor-ready format to confidently present your projections to banks, franchise representatives, or investors.