
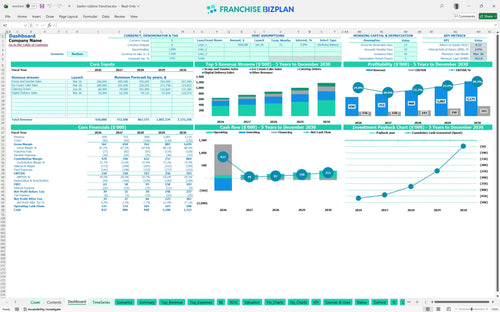
All-in-one Dashboard
Core inputs and core outputs


This detailed financial model for retail food franchise includes integrated income statements, cash flow forecasts, and startup cost trackers designed specifically for a high-volume dessert shop operation.
Core inputs and core outputs
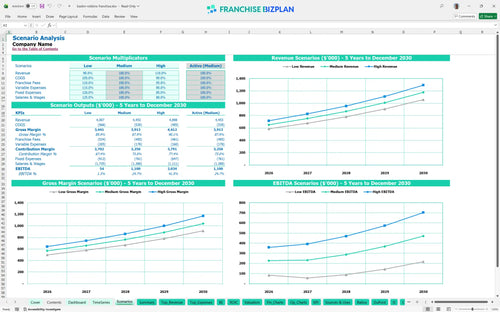
Three scenario analysis
Presentation ready
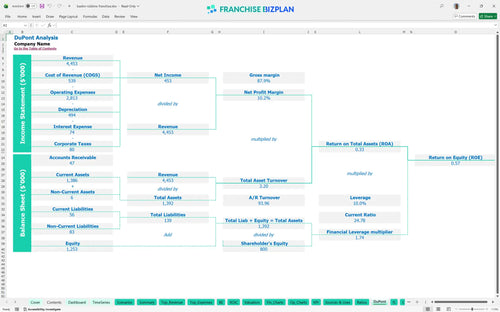
DuPont analysis
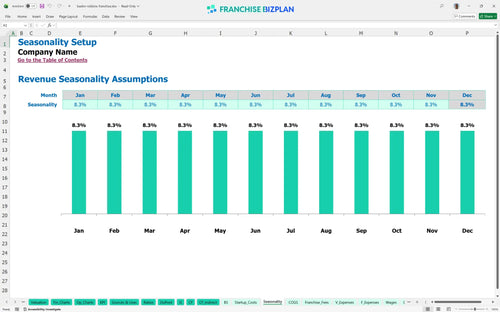
Researched revenue assumptions
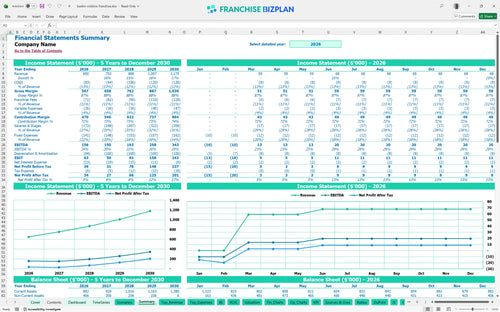
Lender-friendly financial outputs
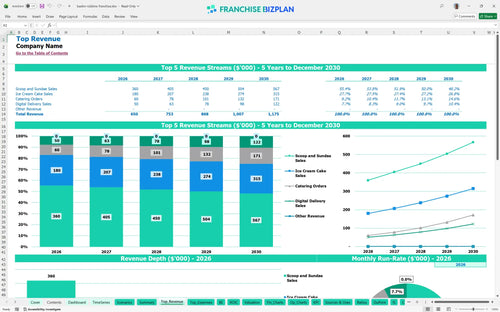
Revenue stream detailed view
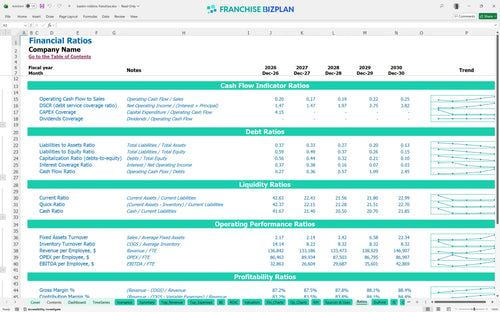
Performance metrics benchmark
We built this franchise unit financial model using deep research into the unit economics of a leading dessert brand. The model comes pre-populated with data like a $156,000 Year 1 EBITDA and a 4-month window to reach break-even, but you can edit every line to fit your specific market. It is a practical tool for estimating ROI for dessert shop franchise locations without the guesswork.
The unit hits profitability almost immediately, showing a positive EBITDA of $156,000 in the first year of operation. By Year 5, as revenue climbs toward $1.175 million, the store-level profit scales to $343,000. This trajectory is defintely dependent on managing the 10.8% ingredient cost and keeping the $9,000 monthly rent in check as a percentage of total sales.
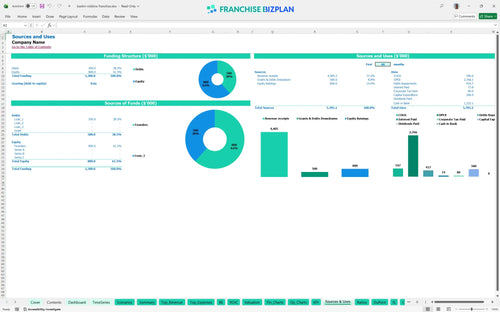
To launch this unit in the US, you will need approximately $500,000 in total startup capital. This includes the $25,000 franchise fee and significant leasehold improvements of $225,000. You also need to account for $95,000 in refrigeration and $55,000 for display cases to meet brand standards. The model helps you understand how to calculate franchise startup costs in Excel by totaling these hard costs and pre-opening expenses.
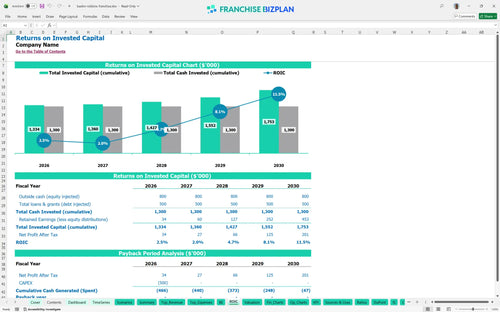
The internal rate of return (IRR) for this unit is 1.98%, with a return on equity (ROE) of 0.57. While the unit generates strong annual cash flow, the initial $500,000 investment means the full payback period extends after year 5. This is a long-term play where value is built through consistent EBITDA growth and potential multi-unit scaling to spread overhead costs.
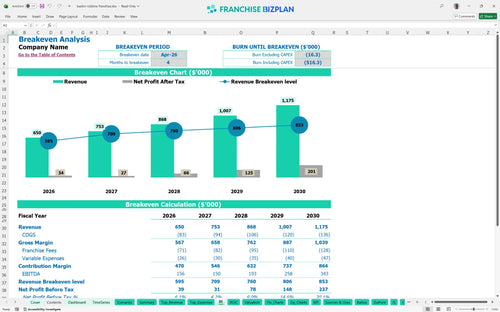
The franchise unit reaches its break-even point in April 2026, just 4 months after launching. This fast start is driven by the $650,000 Year 1 revenue target and the relatively low 10.8% ingredient cost. Calculating monthly overhead for ice cream franchise units is critical here, as the $12,000+ in monthly fixed costs (rent, utilities, and insurance) must be covered by high-volume scoop and sundae sales.
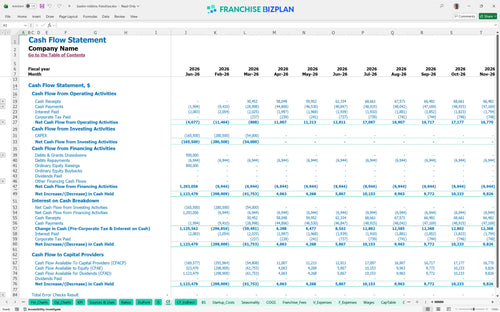
The lowest cash point occurs in March 2026, with a minimum cash balance of $763,000 after accounting for all startup costs and initial working capital. You need to maintain a solid buffer to handle the ramp-up of the assistant manager and crew member positions. This franchise unit cash flow statement example shows that while the business is profitable early, the initial cash outlay is the primary risk factor.
In a high-revenue scenario where sales exceed the $650,000 Year 1 target, your EBITDA margin expands rapidly because the $9,000 rent is fixed. Conversely, a low scenario where digital delivery sales fail to hit the $50,000 mark would squeeze margins due to the 10.9% combined royalty and marketing fee. Financial projections for new franchise location success depend on maintaining at least a medium-case volume to cover the $160,000+ annual management payroll.
Finance: update unit break-even and payback model by Friday.
This franchise unit financial model template is built in Excel to give you total control over your numbers. You can adjust the pre-filled formulas and editable assumptions to match your specific territory, whether you are looking at a high-traffic mall spot or a standalone shop. It is a flexible franchise startup cost spreadsheet that lets you swap out rent, labor rates, and local pricing to see how they impact your bottom line.

Planning for the long term is vital when you are reviewing an ice cream shop business plan. This model provides detailed 5-year revenue forecasts, starting at $650,000 in Year 1 and scaling to $1,175,000 by Year 5. You get a full look at profit and cash flow projections to help you understand how the unit matures as you build local brand loyalty and repeat traffic.

The real economics of a franchise depend on managing the spread between gross margin and franchisor obligations. This tool includes a spreadsheet for franchise royalty and marketing fund tracking, accounting for a 5.9% royalty and a 5.0% marketing fee. By mapping these franchise royalty fees against your monthly sales, you can see exactly how much cash stays in the business after the brand takes its cut.

Launching a new site requires a clear franchise investment calculator to avoid running out of cash before the doors open. We have mapped out the $25,000 initial fee, leasehold improvements, and refrigeration equipment to help you find your break-even point calculation. Knowing the exact sales level required to cover your $9,000 monthly rent and fixed overhead keeps your growth strategy grounded in reality.

This model uses unit economic analysis to compare your projected performance against retail food standards. We have included an operating expense budget that tracks ice cream ingredients starting at 10.8% of sales and crew member wages to ensure your store-level margin stays healthy. These benchmarks help you sanity-check your assumptions before you sign a lease or commit to a multi-unit development schedule.


Simply purchase and download the financial model template, then access it instantly using Microsoft Excel or Google Sheets. No installation or technical expertise required-just open and start working.

Enter your business-specific numbers, including revenue projections, costs, and investment details. The pre-built formulas will automatically calculate financial insights, saving you time and effort.

Leverage the investor-ready format to confidently showcase your financial projections to banks, franchise representatives, or investors. Impress stakeholders with clear, data-driven insights and professional reports.

Leverage the investor-ready format to confidently present your projections to banks, franchise representatives, or investors.