
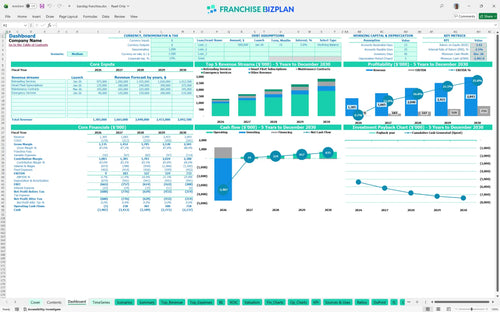
All-in-one Dashboard
Core inputs and core outputs


This comprehensive tool includes five-year projections, CAPEX schedules, and detailed labor modules designed specifically for industrial retreading operations.
Core inputs and core outputs
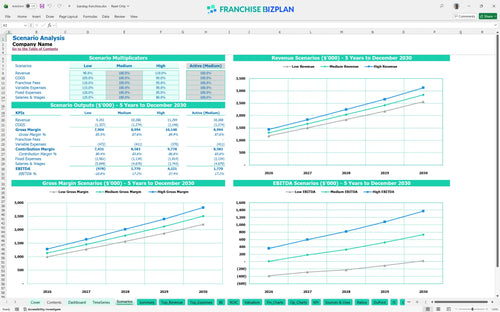
Three scenario analysis
Presentation ready
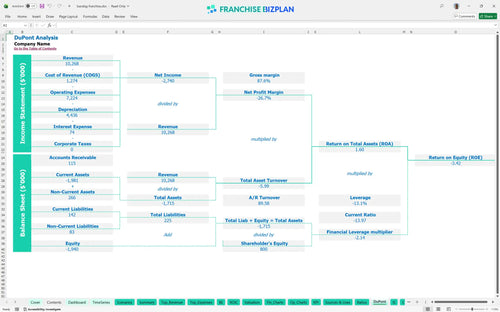
DuPont analysis
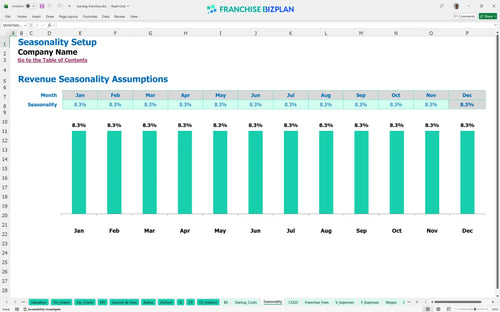
Researched revenue assumptions
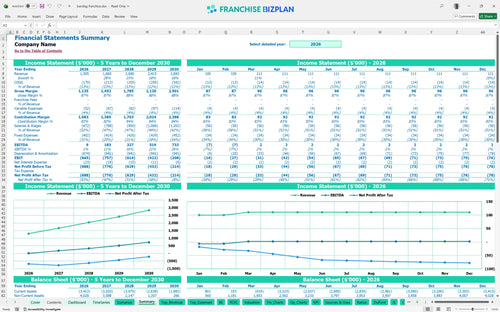
Lender-friendly financial outputs
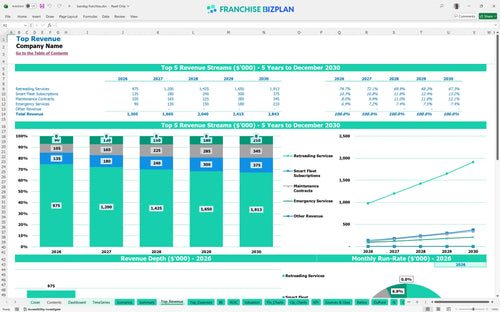
Revenue stream detailed view
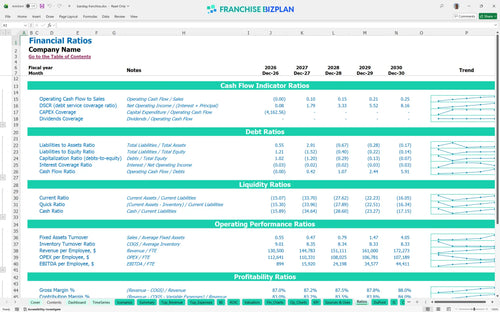
Performance metrics benchmark
We built this franchise unit financial model using our own research into the commercial tire retreading business plan. Key assumptions like the $1,305,000 Year 1 revenue and the $4,702,500 total investment are pre-populated and fully editable to match your specific territory and operating scenario.
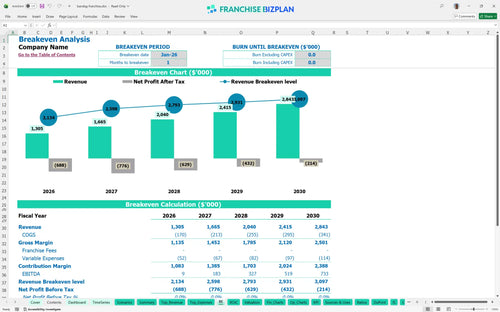
Assessing profitability of fleet management franchise units requires looking past the $9,000 Year 1 EBITDA. This franchise unit profitability analysis shows that as you scale to $2,843,000 in revenue by Year 5, your EBITDA grows to $733,000, provided you manage the 11% raw material costs.
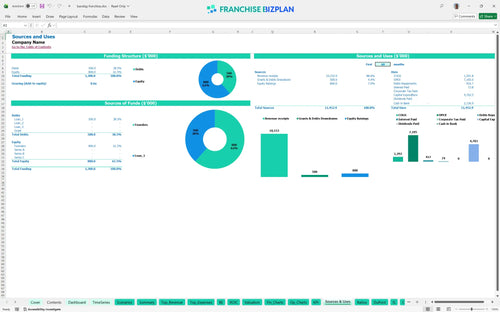
Your startup budget spreadsheet for logistics business shows a total spend of $4,702,500 to launch in the US. This covers everything from the initial $2,500 franchise fee to the massive $2.5M robotic equipment investment needed to start operations.
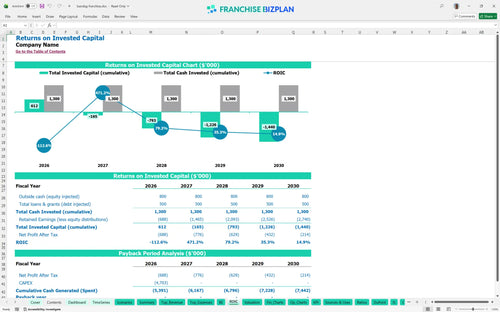
ROI analysis for franchises indicates a payback period extending past Year 5. While evaluating franchise investment returns in logistics, you should focus on the cost-per-mile analysis for fleet maintenance businesses to drive the repeat demand needed to improve the -2.5% IRR and -3.42% ROE. This defintely requires a long-term outlook.
Break-even happens in Jan-2026, just 1 month after launch, but that assumes you hit the ground running with $1.3M in Year 1 sales. This revenue stream modeling depends heavily on securing maintenance contracts and fleet maintenance franchise opportunities early in the ramp-up phase.
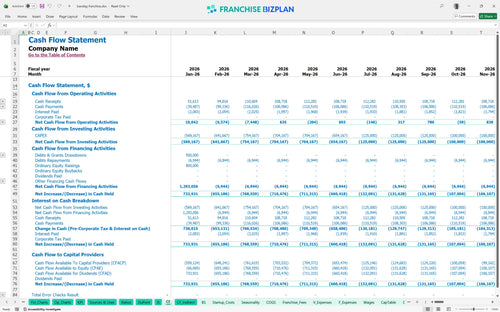
The lowest cash point hits -$3,487,000 in December 2026. When projecting revenue for commercial tire service center operations, you must ensure you have enough runway to handle this deficit before the Year 2 revenue of $1.66M kicks in. This Excel template for franchise unit cash flow forecasting helps you visualize that gap.
Capital expenditure forecasting is critical when you are spending $4.7M upfront. Moving from the $9,000 Year 1 EBITDA baseline to the $733,000 Year 5 High case depends on hitting your $1.275M retreading revenue mark while keeping consumables at the 2% target.
Finance: update unit break-even and payback model by Friday.
This franchise financial model template is built in Excel, allowing you to tweak every variable from raw material costs to local rent. You can adjust the pre-filled formulas to test different site selections or labor structures without breaking the logic, making it easy to adapt to your specific territory.

This pro forma financial statement template for franchise units delivers a full 5-year outlook. It builds an operating expense budget that tracks everything from $48,000 technician salaries to $2,500 monthly property insurance, giving you a clear view of long-term cash flow and sustainable growth.

The franchise startup cost spreadsheet accounts for the $2,500 initial fee and ongoing obligations. Since the royalty and marketing fees are currently set at 0% in this specific scenario, your store-level margin stays higher, but you must still track these categories for future adjustments as the chain evolves.

Use this break-even point calculator to determine exactly when your retreading volume covers your $34,500 in monthly fixed costs. Learning how to calculate startup costs for a tire retreading franchise is the first step in managing your $4.7M initial outlay and understanding your margin profile.

We use essential financial metrics for new franchise owners to validate your projections. This financial model template for industrial service franchises includes benchmarks for rent and utilities to ensure your $18,000 monthly facility cost stays within a healthy percentage of your $1.3M annual sales.


Simply purchase and download the financial model template, then access it instantly using Microsoft Excel or Google Sheets. No installation or technical expertise required-just open and start working.

Enter your business-specific numbers, including revenue projections, costs, and investment details. The pre-built formulas will automatically calculate financial insights, saving you time and effort.

Leverage the investor-ready format to confidently showcase your financial projections to banks, franchise representatives, or investors. Impress stakeholders with clear, data-driven insights and professional reports.

Leverage the investor-ready format to confidently present your projections to banks, franchise representatives, or investors.