
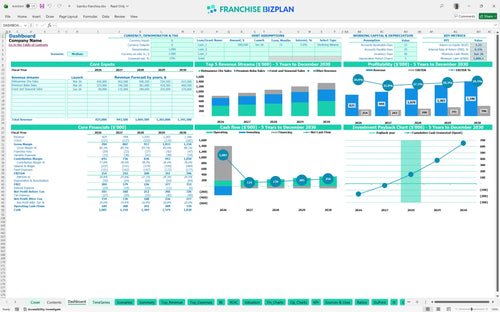
All-in-one Dashboard
Core inputs and core outputs


This tool includes a franchise unit profitability calculator, dynamic capital expenditure planning schedules, and detailed payroll modules to simplify your financial planning for retail food franchise locations.
Core inputs and core outputs
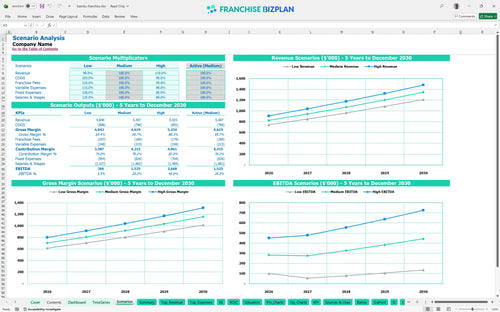
Three scenario analysis
Presentation ready
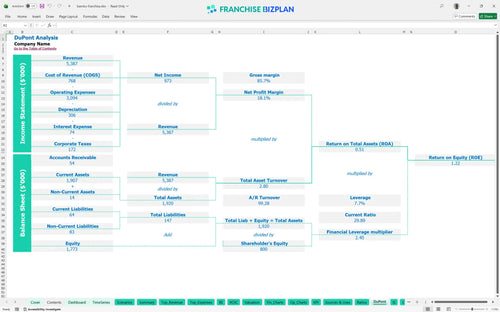
DuPont analysis
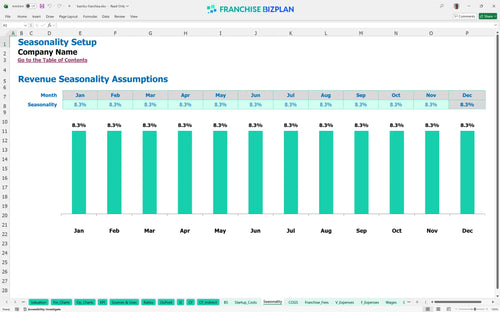
Researched revenue assumptions
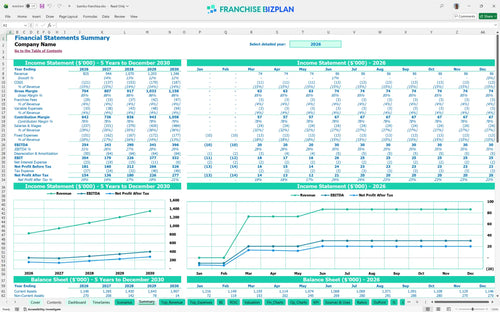
Lender-friendly financial outputs
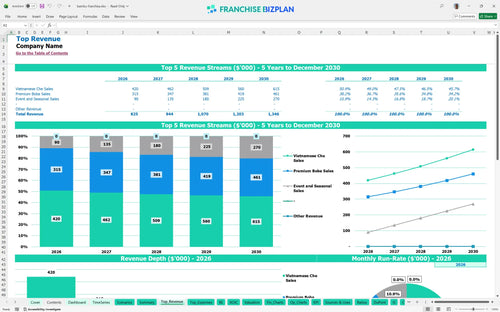
Revenue stream detailed view
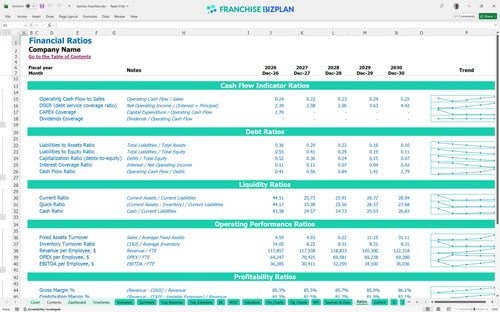
Performance metrics benchmark
We built this franchise unit financial model using our own research to reflect the actual costs of running a premium dessert shop. Key assumptions like the $825,000 year-one revenue and 3.5% royalty are pre-populated and fully editable to match your specific market. This model provides a financial feasibility study for small business franchise owners who need to move beyond guesswork.
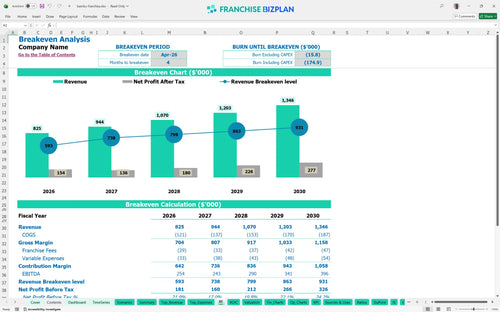
This unit hits profitability fast, reaching break-even by April 2026, just four months after launching. With Year 1 EBITDA projected at $254,000, the model shows how consistent traffic and low royalties drive early cash flow. Here's the quick math: high-margin Vietnamese Chè sales are the engine here.
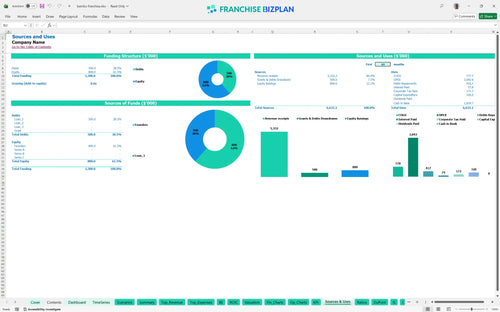
You need approximately $320,000 to get the doors open, with the largest chunk going toward $130,000 in leasehold improvements. This franchise unit financial model for dessert shops ensures you account for the $49,000 franchise fee and $60,000 in kitchen equipment. Managing your capital expenditure planning early prevents mid-construction cash crunches.
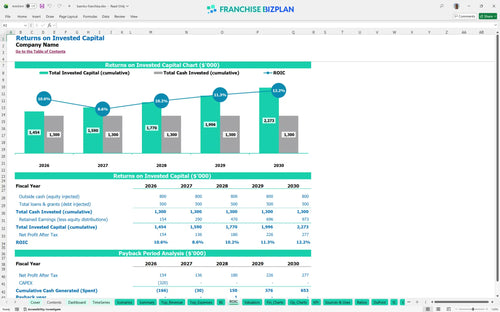
Expect a 3-year payback period and an internal rate of return (IRR) of 6.11% based on the current five-year forecast. While the IRR reflects a realistic ramp-up, the return on equity (ROE) of 1.22 shows the potential for steady, long-term wealth building. Food franchise ROI depends less on the brand name and more on your site selection and throughput.
The monthly break-even point occurs in month four, driven largely by the $8,500 prime location rent and a $58,000 manager salary. Estimating ROI for a new bubble tea franchise requires keeping food costs near the 12.5% target to maintain this timeline. If opening takes 90+ days longer than planned, working capital pressure rises quickly.
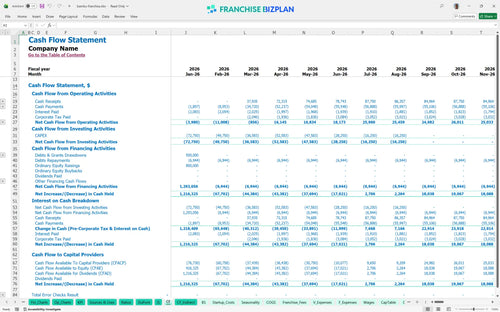
Your lowest cash point is projected for June 2026, meaning you defintely need a solid working capital buffer to handle the initial ramp-up. Even with strong early sales, timing gaps between inventory purchases and daily receipts can create temporary pressure. This franchise profitability analysis spreadsheet helps you map those gaps before they become crises.
Switching between Low, Medium, and High scenarios shows how a dip in traffic delays payback and impacts your year-1 EBITDA of $254,000. Using an excel template for boba tea franchise financial projections allows you to see how the $8,500 rent eats into margins if sales underperform. Still, the high case offers a clear path to $1.3M in annual sales.
This franchise financial model template is built in Excel, allowing you to tweak every variable from drink prices to local labor rates. It uses pre-filled formulas so you can test different 'what-if' scenarios without breaking the math or needing a degree in finance. Honestly, having a flexible franchise business plan excel file is the only way to handle the moving parts of a new territory.

Plan your multi-unit expansion or single-store exit with a full 5-year franchise financial projection model. It tracks revenue scaling from $825,000 in year one to over $1.3 million by year five, accounting for seasonal spikes and market maturation. Every 1-point margin leak matters fast in a single-unit model, so seeing the five-year horizon is vital.

Managing the 3.5% royalty fee is straightforward with this tool, ensuring you see exactly how much goes to the franchisor each month. Since the brand fund is currently 0%, you can model how your bottom line changes if that contribution ever shifts in the future. Knowing your franchise operating expenses helps you stay ahead of the franchisor's billing cycle.

Use this franchise startup cost spreadsheet to map out the initial investment, covering everything from the $49,000 franchise fee to leasehold improvements. It identifies the exact month you stop burning cash and start generating profit, which is essential for managing your bank's expectations. Knowing how to calculate startup costs for a beverage franchise saves you from nasty surprises during build-out.

Compare your $8,500 monthly rent and 12.5% food costs against industry averages for dessert and beverage shops to ensure your unit economics stay healthy. This helps you spot margin leaks early, especially when managing labor and food costs in a franchise model. Restaurant unit economics live and die by these small percentage shifts.


Simply purchase and download the financial model template, then access it instantly using Microsoft Excel or Google Sheets. No installation or technical expertise required-just open and start working.

Enter your business-specific numbers, including revenue projections, costs, and investment details. The pre-built formulas will automatically calculate financial insights, saving you time and effort.

Leverage the investor-ready format to confidently showcase your financial projections to banks, franchise representatives, or investors. Impress stakeholders with clear, data-driven insights and professional reports.

Leverage the investor-ready format to confidently present your projections to banks, franchise representatives, or investors.