
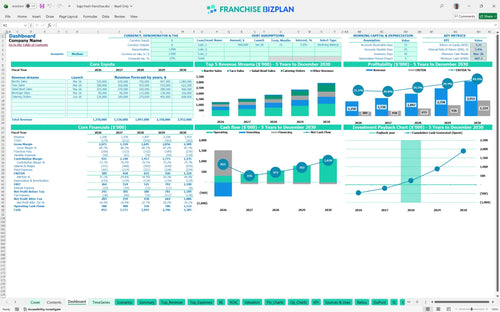
All-in-one Dashboard
Core inputs and core outputs


This franchise unit financial model provides a complete Excel-based toolkit for projecting revenue, managing startup costs, and analyzing 5-year profitability for a fast casual restaurant.
Core inputs and core outputs
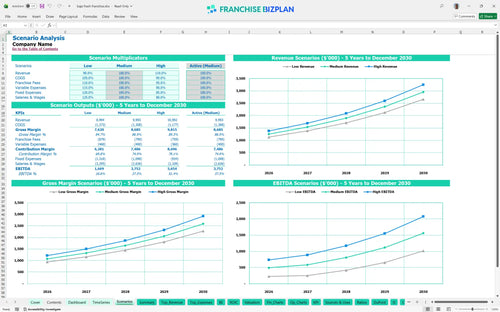
Three scenario analysis
Presentation ready
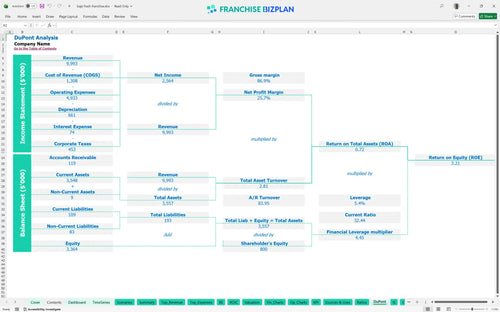
DuPont analysis
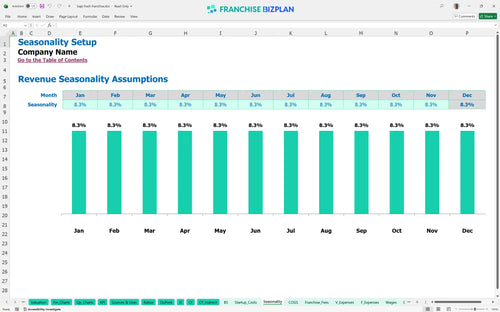
Researched revenue assumptions
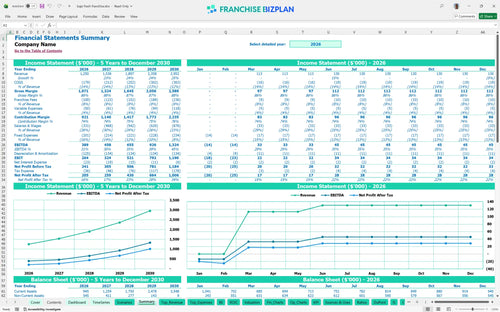
Lender-friendly financial outputs
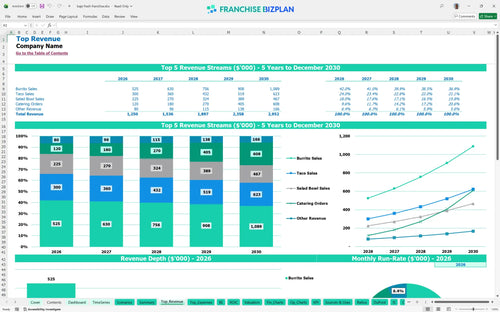
Revenue stream detailed view
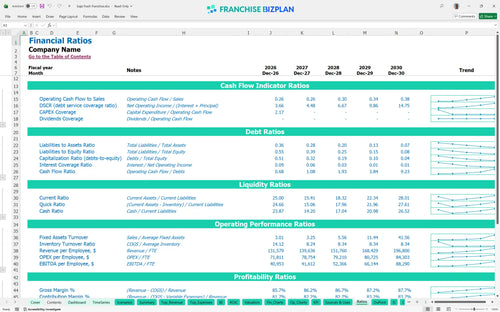
Performance metrics benchmark
We built this financial feasibility study for fast casual restaurant (a report on whether the business will work) using detailed research on unit-level performance and typical Mexican grill operating costs. The model comes pre-populated with data showing a year-one revenue of $1,250,000 and an EBITDA (earnings before interest, taxes, depreciation, and amortization) of $389,000, all of which you can edit to fit your specific site. It handles everything from your initial $30,000 fee to the 8% total royalty and marketing burden so you can focus on execution.
You can expect this unit to reach profitability in its first year, specifically by March 2026, which is just three months after launch. The model calculates net profit by subtracting your 12.5% food COGS, 8% franchise fees, and $12,000 monthly rent from your burrito and taco sales. To be fair, hitting the $389k year-one EBITDA target requires disciplined labor management and high-volume throughput during the lunch rush. Profit is a habit, not an accident.
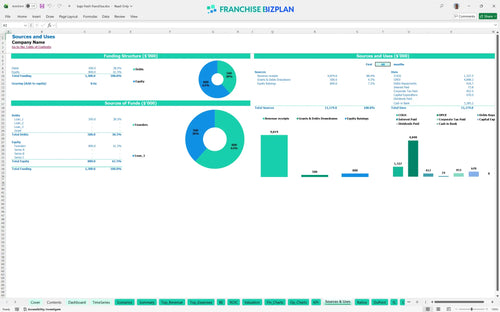
The total capital expenditure planning (spending on long-term assets) for this unit requires approximately $670,000 in upfront investment. This covers the $350,000 leasehold improvements, $150,000 for kitchen equipment like grills and salsa bars, and the $30,000 initial franchise fee. You also need to account for a minimum cash balance of $607,000 to handle the ramp-up period through March 2026. Still, having this buffer ensures you can pay your $65,000 manager salary even during the first few weeks. Build it right or build it twice.
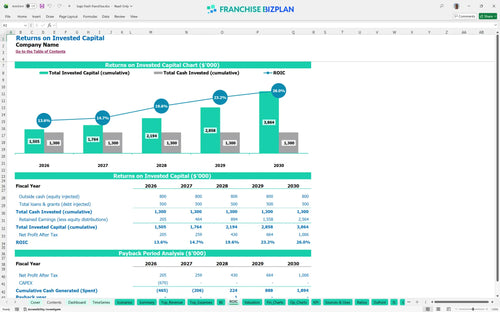
Your investment shows a 5.43% IRR (internal rate of return) and a 3.21% ROE (return on equity) over the five-year period. The model projects a 3-year payback period (the time to get your initial cash back), meaning you recover your initial $670,000 investment by the end of 2028. This is how to calculate ROI for a fast casual franchise: you look at the cash remaining after all royalties and the $12,000 monthly rent are paid. Patience pays the bills.
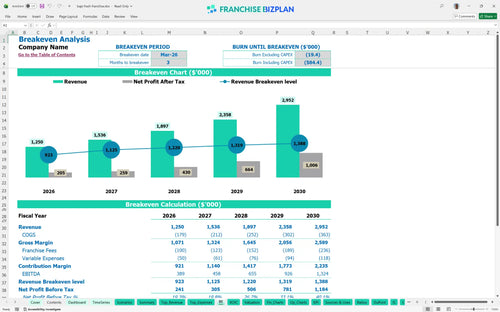
The unit hits its break-even point in March 2026, roughly three months after the initial launch. To cover your $12,000 rent and $2,000 in utilities, you need to maintain steady volume across burritos, tacos, and salad bowls. The franchise unit operational expense spreadsheet shows that labor is your biggest lever; keeping front-of-house staff aligned with peak traffic is essential. If your catering program for nearby medical centers launches on time in June, you will defintely stabilize much faster. Speed of service is the speed of profit.
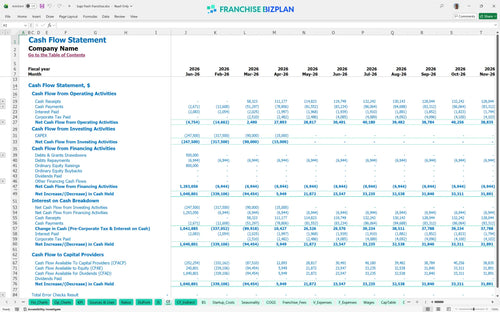
Your lowest cash point is $607,000, which occurs in March 2026 during the final stages of the initial ramp-up. You need enough runway (the time before you run out of money) to cover the $12,000 rent and $5,400 in monthly manager salaries before the unit becomes self-sustaining. Honestly, the timing of your $350,000 build-out payments is the biggest risk to your liquidity. We recommend keeping a 10% contingency buffer above the model's minimum cash estimate. Cash is oxygen for a new store.
Projecting revenue for new restaurant franchise location involves looking at Low, Medium, and High traffic scenarios. In the High case, Year 5 revenue can reach $2.95M, significantly improving your 5.43% IRR. However, a 10% drop in volume in the Low case could push your payback period beyond the 3-year mark. The model lets you stress-test how a 1-point increase in food costs or a 5% bump in labor affects your year-one $389k EBITDA. Plan for the worst, but execute for the best.
Finance: update unit break-even and payback model by Friday.
This franchise startup cost template is fully editable in Excel, allowing you to adjust every assumption for your specific territory or site. You can defintely swap out the pre-filled numbers for your own local rent, labor rates, and supply costs to see how they impact your bottom line. It uses linked formulas so one change updates your entire restaurant profitability analysis instantly. Honestly, it is the fastest way to move from a guess to a data-driven plan. One change here updates everything everywhere.

Plan your long-term growth with a restaurant franchise profit and loss template that spans sixty months of operation. You get a clear view of how revenue scales from $1.25M in the first year to over $2.95M by year five as your local reputation grows. These operating expense projections (costs to run the business) help you anticipate when to hire more shift supervisors or when to reinvest in the facility. Plus, the balance sheet and cash flow views ensure you never get caught off guard by timing gaps. Five years is a long time to guess.

Managing your franchise royalty fee structure (the percentage of sales paid to the brand) is critical for maintaining store-level margins in a high-volume fast casual environment. This model calculates the 5% royalty and 3% marketing fund contributions automatically based on your gross sales forecasts. It helps you see the real cost of the brand before you pay your own bills. Unit economic modeling like this is the only way to ensure your $1.25M in annual sales actually leaves enough cash for the owner. Royalties are a top-line tax you must plan for.

Use this startup budget template for retail food franchise to map out every dollar needed before your doors open in March 2026. It covers the $30,000 franchise fee, $350,000 build-out, and $150,000 in kitchen equipment so you know your total entry price. The break-even analysis (the point where sales cover all costs) shows exactly what daily volume you need to cover the $12,000 monthly rent and fixed overhead. Knowing your floor helps you stay calm during the ramp-up phase. If you don't know your break-even, you don't know your risk.

Estimating labor and food costs for restaurant franchises is easier when you have a baseline to compare against. This model includes benchmarks for food COGS (cost of goods sold) at 12.5% and packaging at 1.8% to keep your projections realistic. You can compare your $65,000 manager salary and $12,000 rent against industry standards for prime locations. It helps you spot margin leaks before they become expensive problems in your daily operations. Benchmarks are the guardrails for your bank account.


Simply purchase and download the financial model template, then access it instantly using Microsoft Excel or Google Sheets. No installation or technical expertise required-just open and start working.

Enter your business-specific numbers, including revenue projections, costs, and investment details. The pre-built formulas will automatically calculate financial insights, saving you time and effort.

Leverage the investor-ready format to confidently showcase your financial projections to banks, franchise representatives, or investors. Impress stakeholders with clear, data-driven insights and professional reports.

Leverage the investor-ready format to confidently present your projections to banks, franchise representatives, or investors.