
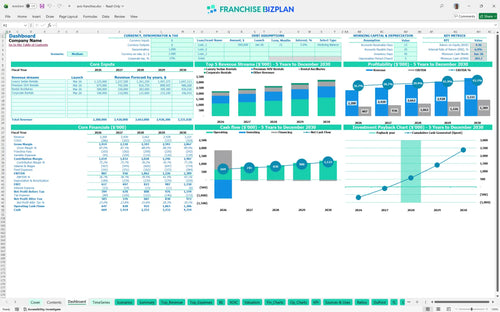
All-in-one Dashboard
Core inputs and core outputs


This Excel template for franchise unit financial forecasting provides a complete toolkit to project revenue, manage fleet depreciation, and track the 3-year payback period for your investment.
Core inputs and core outputs
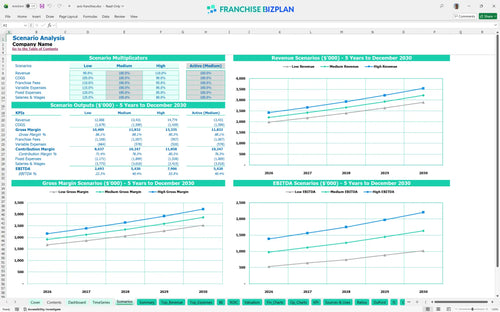
Three scenario analysis
Presentation ready
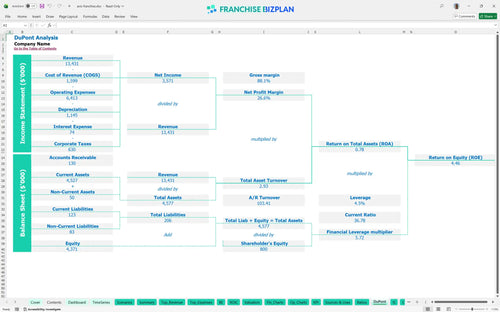
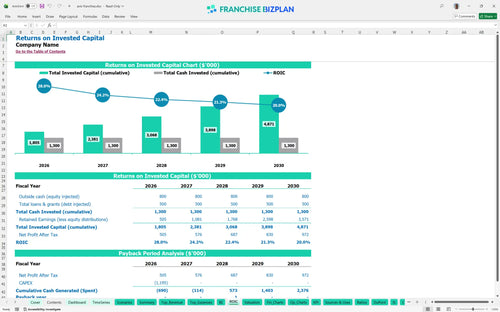
DuPont analysis
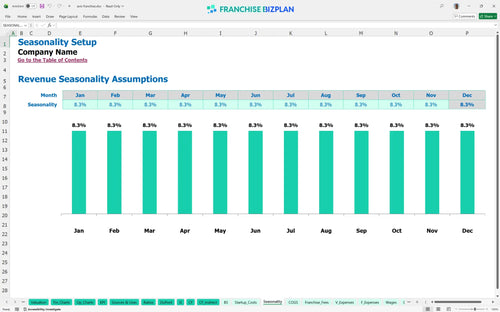
Researched revenue assumptions
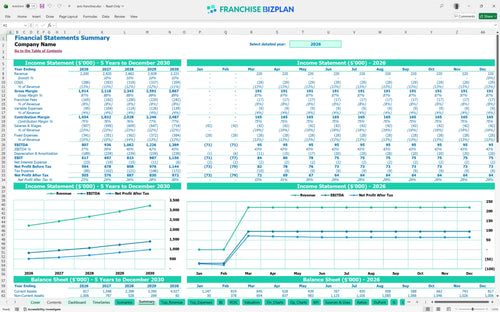
Lender-friendly financial outputs
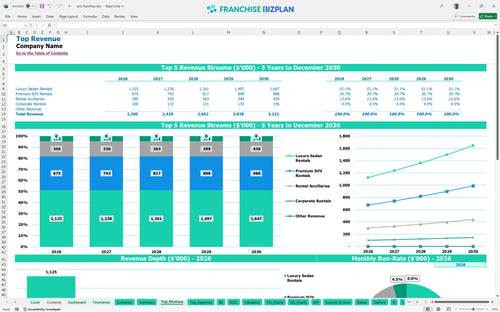
Revenue stream detailed view
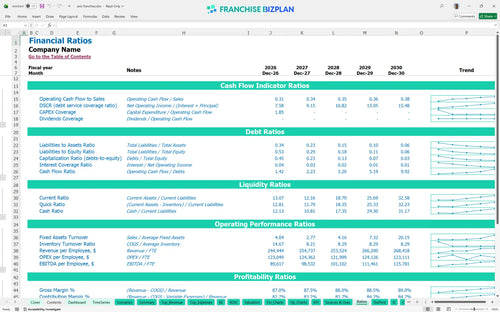
Performance metrics benchmark
We built this franchise unit financial model using our own research to help you navigate the high-capital world of vehicle leasing. Key assumptions like luxury fleet depreciation, royalty fees of 7.5%, and prime location rent are pre-populated and fully editable. With a projected year-one EBITDA of $807,000, this model provides a data-driven look at your potential return.
The unit hits its break-even point in April 2026, just four months after launching. With year-one EBITDA starting at $807,000 and climbing to $1.389 million by year five, the model shows a strong upward trend. Profitability is driven by high-margin luxury sedan and SUV rentals which account for the bulk of the $2.2 million initial annual revenue.
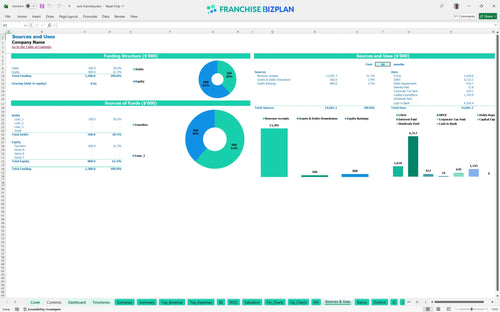
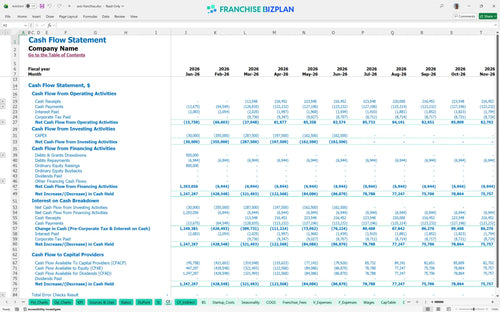
You will need approximately $1,195,000 to launch this franchise unit in the US. This covers the $30,000 franchise fee, $650,000 for the initial luxury fleet, and $250,000 for leasehold improvements. Plus, you must maintain a minimum cash buffer of $204,000, which the model shows occurs around June 2026.
Investors can expect an Internal Rate of Return (IRR) of 5.96% and a Return on Equity (ROE) of 4.46%. The payback period is estimated at 3 years, which is reasonable for a capital-intensive automotive franchise. While the IRR might look conservative, it reflects the heavy upfront cost of a premium fleet and prime real estate.
The unit reaches its monthly break-even point in April 2026, requiring enough volume to cover $18,000 in rent and $32,416 in monthly salaries. The biggest driver here is fleet utilization; you need those luxury sedans on the road to cover the 10.5% depreciation and fixed site costs. If the ramp-up is slower, that April date will defintely push back.
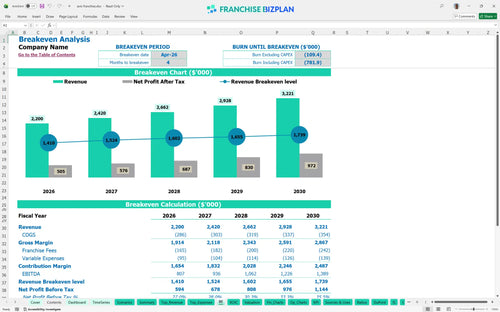
Your lowest cash point is $204,000 in June 2026, so you need to ensure your initial funding covers the first six months of operations. The model suggests a 4-month runway to break-even, but keeping that buffer is critical for fleet maintenance. What this estimate hides is the potential for unexpected vehicle repairs or insurance spikes.
The model allows you to toggle between scenarios to see how a 10% drop in revenue affects your 3-year payback. In a High scenario, hitting $2.2 million in year one with better labor productivity significantly boosts your ROE. A Low scenario might push the break-even date past April 2026, increasing the need for that $204,000 cash buffer.
This rental car franchise financial model lives in Excel, so you can tweak every assumption to fit your specific market. Whether you are adjusting fleet size or local labor rates, the pre-filled formulas handle the heavy lifting. It is built for operators who need to test different scenarios without breaking the spreadsheet.

Planning for a car rental business plan Excel requires a long-term view of fleet cycles and revenue growth. This model projects five years of income statements and cash flows, showing how your unit scales from $2.2 million in year one to over $3.2 million by year five. It helps you see the road ahead for both single units and multi-unit expansion.

Managing franchise royalty fee calculation is vital because these costs come off the top. The model tracks the 7.5% royalty fee and the $30,000 initial fee to ensure your store-level margin stays accurate. Honestly, knowing exactly how much goes to the brand fund versus your pocket is the only way to run a tight ship.

Figuring out how to calculate startup costs for a rental car franchise is the first step to avoiding a cash crunch. This template breaks down the $1,195,000 initial investment, including the $650,000 fleet acquisition and $250,000 in leasehold improvements. It maps out the path to the April 2026 break-even date so you know exactly when the bleeding stops.

We have baked in automotive franchise financial projections based on real-world performance data. You can compare your $18,000 monthly rent or 10.5% vehicle depreciation against industry norms to see if your site selection is efficient. It is a reality check that ensures your franchise unit profitability analysis is not just wishful thinking.


Simply purchase and download the financial model template, then access it instantly using Microsoft Excel or Google Sheets. No installation or technical expertise required-just open and start working.

Enter your business-specific numbers, including revenue projections, costs, and investment details. The pre-built formulas will automatically calculate financial insights, saving you time and effort.

Leverage the investor-ready format to confidently showcase your financial projections to banks, franchise representatives, or investors. Impress stakeholders with clear, data-driven insights and professional reports.

Leverage the investor-ready format to confidently present your projections to banks, franchise representatives, or investors.