
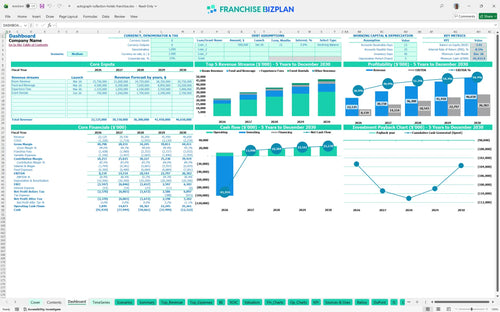
All-in-one Dashboard
Core inputs and core outputs


This hospitality franchise unit financial performance metrics template provides a complete roadmap for analyzing the feasibility, cash flow, and long-term value of a high-end boutique hotel investment.
Core inputs and core outputs
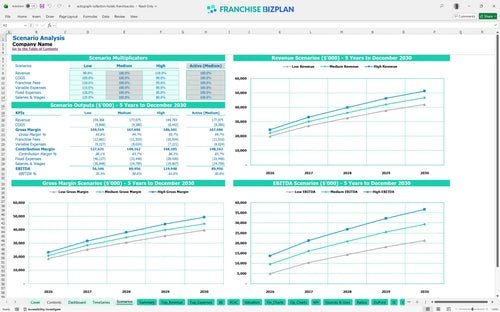
Three scenario analysis
Presentation ready
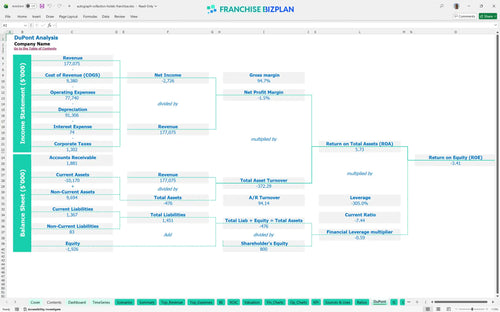
DuPont analysis
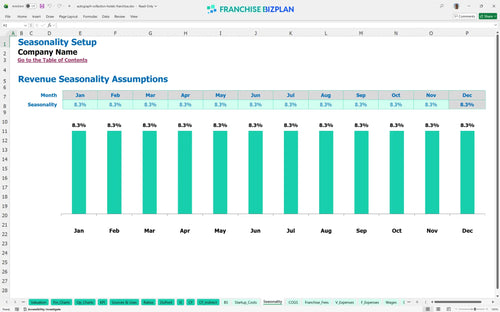
Researched revenue assumptions
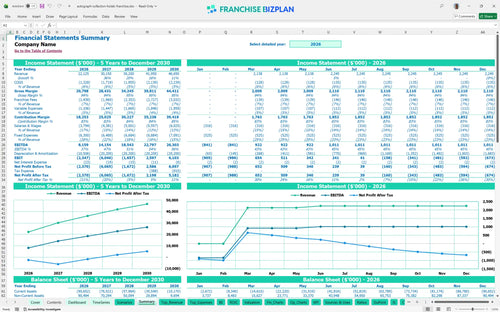
Lender-friendly financial outputs
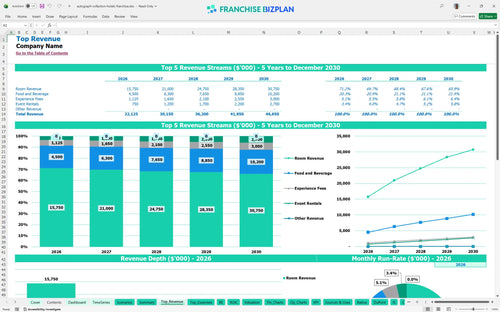
Revenue stream detailed view
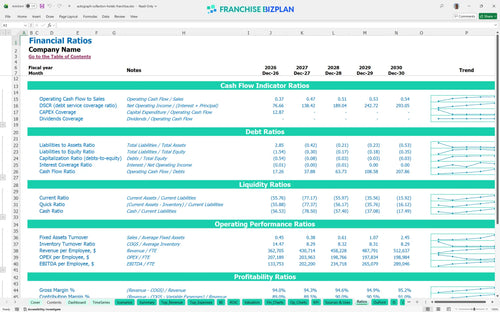
Performance metrics benchmark
We developed this boutique hotel financial model Excel template using detailed research into luxury hospitality standards and historic conversion costs. Key assumptions like the $22.1 million year-one revenue target and specific labor costs for a 50-person housekeeping team are pre-loaded but fully adjustable to fit your specific market. This tool simplifies the profitability analysis for luxury hotel franchises by mapping every dollar from the rooftop lounge to the front desk.
While the model shows an EBITDA of $8.1 million in the first year, true net profitability is weighed down by the massive $101 million initial capital outlay. Based on the current trajectory, the unit generates strong operational cash flow immediately, but the total investment payback extends beyond the five-year window. To be fair, luxury hotel investment is a long-game play.
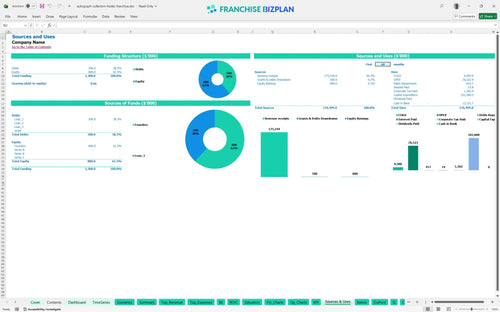
Launching this luxury hotel requires a significant investment, primarily driven by the $45 million historic renovation and $12 million for HVAC and elevators. Total startup costs exceed $100 million when you include the $100,000 franchise fee and $18 million for guest room FF and E. Here is the quick math: your renovation budget is your biggest risk factor.
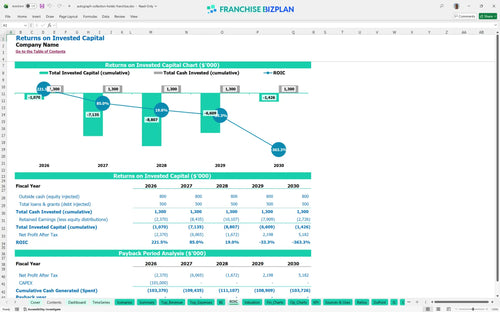
The investment return calculator for independent hotel brands shows a challenging initial period with an IRR of -0.46% and a ROE of -3.41% over the first five years. This is common for a financial feasibility study for historic building conversion where the heavy upfront CAPEX requires a longer horizon for full recovery. Still, the year-five EBITDA margin of 56% shows the brand's long-term strength.
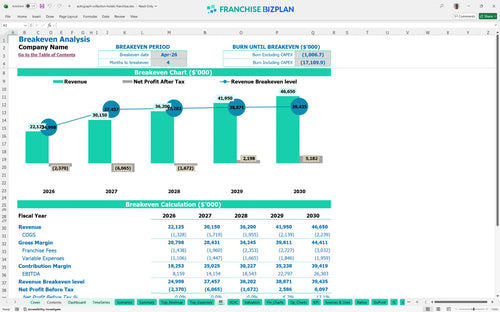
You hit operational break-even in April 2026, just four months after launching the guest rooms. The primary driver for this is room revenue, which must offset the $300,000 monthly riverfront lease and $280,000 annual GM salary to keep the doors open. Honestly, your revenue projections for riverfront hospitality properties depend entirely on maintaining high occupancy during the week.
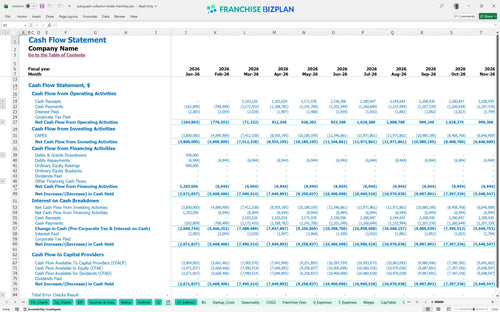
The lowest cash point hits in December 2026 at negative $91.9 million, reflecting the intense renovation phase before the property fully ramps up. You defintely need a robust financing structure or equity partner to bridge the gap between construction and stabilized operations. If opening takes 90+ days longer than planned, working capital pressure rises fast.
A 10% drop in room revenue in a Low scenario significantly delays the break-even date and deepens the peak cash need. Conversely, hitting High targets through better local marketing execution can push Year 5 EBITDA toward $30 million, making the long-term investment much more attractive. Best practices for hotel franchise financial planning require testing these extremes before signing.
Finance: update unit break-even and payback model by Friday
This hotel franchise financial model lives in Excel, so you can tweak every variable from occupancy rates to seasonal room pricing. We built it with open formulas, meaning you aren't locked into a black box when calculating your specific riverfront property's potential. Every 1-point margin leak matters fast in a high-overhead luxury model.

Mapping out a five-year horizon is critical for a luxury hotel investment template, especially when scaling from $22.1 million in year one to over $46.6 million by year five. This view lets you track how debt service and depreciation impact your bottom line as the property matures. What this estimate hides is the timing gap between massive construction costs and stabilized occupancy.

Beyond the $100,000 initial fee, you have to account for the 5% royalty and 1.5% marketing fund that hit your top line every month. This model automates those calculations so you see exactly how much goes to the brand before you cover your own local payroll. The franchise royalty fee structure is a fixed burden that requires high average daily rates to sustain.

With massive upfront costs like $45 million for historic renovations and $18 million for guest room furnishings, knowing your break-even point is non-negotiable. The model identifies the exact occupancy and average daily rate needed to cover your $300,000 monthly lease and other fixed burdens. Break-even depends less on headline sales and more on manager productivity and utility control.

We include hospitality revenue forecasting benchmarks to help you verify if your 3.8% OTA commission or your housekeeping labor spend is in line with luxury standards. It's a reality check to ensure your franchise business plan Excel isn't overly optimistic about store-level margins. Using real numbers helps you spot where your hotel operational budget might be leaking cash.


Simply purchase and download the financial model template, then access it instantly using Microsoft Excel or Google Sheets. No installation or technical expertise required-just open and start working.

Enter your business-specific numbers, including revenue projections, costs, and investment details. The pre-built formulas will automatically calculate financial insights, saving you time and effort.

Leverage the investor-ready format to confidently showcase your financial projections to banks, franchise representatives, or investors. Impress stakeholders with clear, data-driven insights and professional reports.

Leverage the investor-ready format to confidently present your projections to banks, franchise representatives, or investors.