
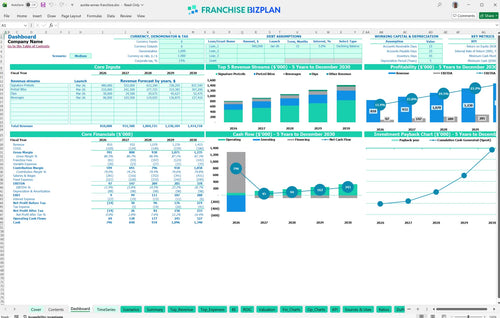
All-in-one Dashboard
Core inputs and core outputs


This franchise unit financial model template provides a complete Excel-based toolkit for projecting revenue, expenses, and investor returns for a single retail location.
Core inputs and core outputs
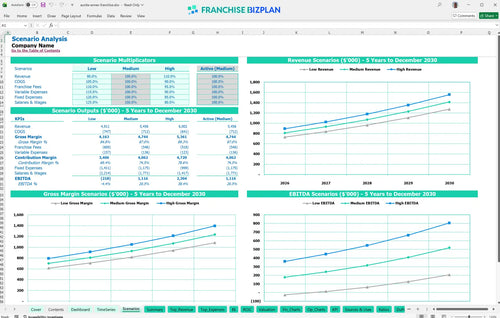
Three scenario analysis
Presentation ready
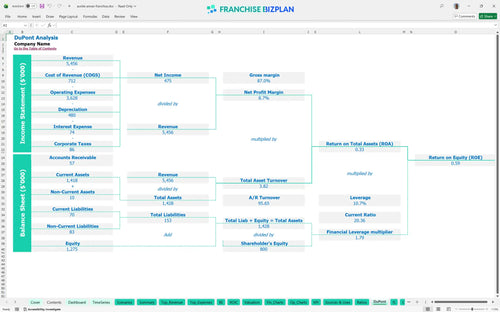
DuPont analysis
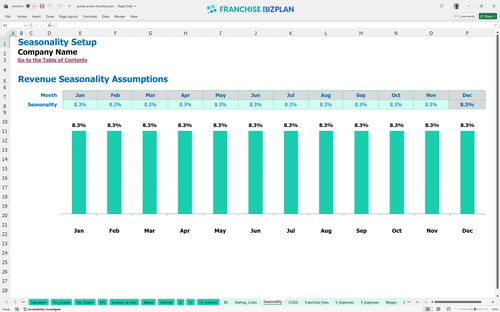
Researched revenue assumptions
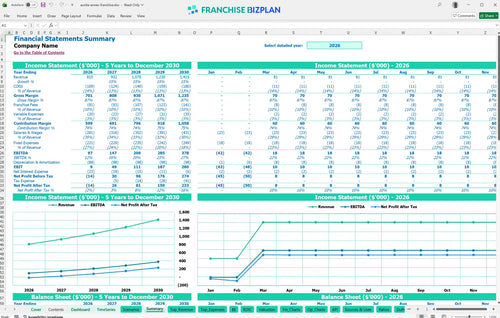
Lender-friendly financial outputs
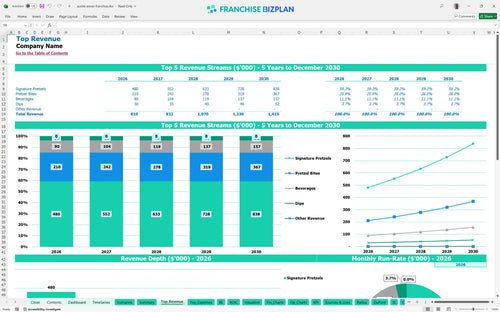
Revenue stream detailed view
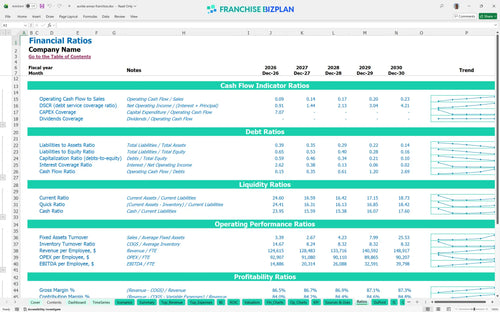
Performance metrics benchmark
We built this franchise business plan template using detailed research on high-traffic retail snack units. Key assumptions, including the $810,000 Year 1 revenue target and 7% royalty fees, are pre-populated and fully editable for your specific site. This franchise investment feasibility study helps you move from a rough idea to a data-driven execution plan.
The unit reaches profitability in Year 1 with a projected EBITDA of $97,000 after accounting for all food costs and royalties. This franchise unit profitability projection model shows earnings growing to $378,000 by Year 5 as revenue scales. Here's the quick math: your net profit depends on maintaining a tight 11.5% food cost and managing the 3.5 FTE crew member starting staff.
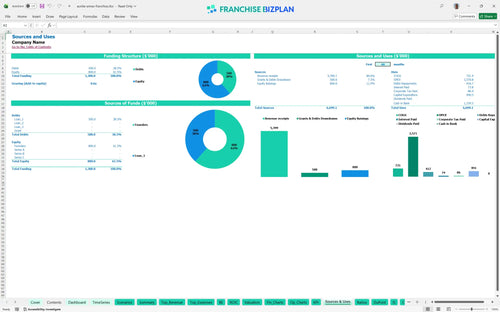
You need a total initial investment that covers $490,500 in hard costs plus a working capital buffer. The CAPEX budget includes $220,000 for leasehold improvements and $110,000 for baking equipment to handle high-volume production. Estimating operating expenses for retail food units early ensures you have enough cash to reach the April 2026 break-even date.
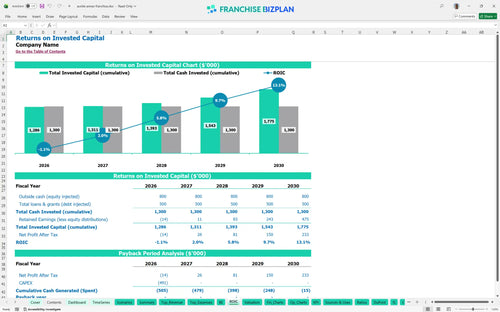
This model projects a 1.9% internal rate of return and a return on equity of 0.59. How to evaluate franchise investment performance depends on your outlook, as the payback period defintely extends past the five-year mark. Still, the steady climb in EBITDA suggests a strong long-term asset if you can maintain high throughput in a prime location.
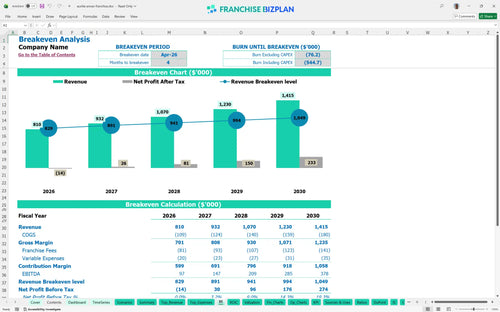
The unit hits its monthly break-even point in April 2026, just four months after the initial launch. This Excel spreadsheet for franchise financial forecasting shows that the $11,000 monthly rent is your biggest fixed hurdle. To be fair, reaching this point quickly requires hitting your $320,000 signature pretzel sales target in the first year.
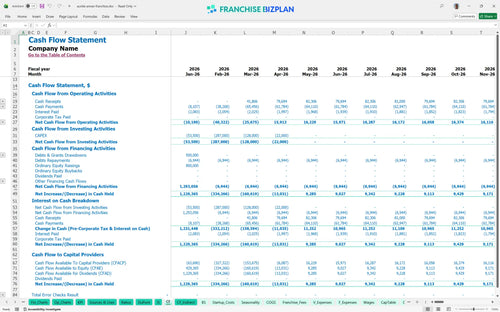
The lowest cash point is $721,000 in April 2026, which represents the peak capital at risk before the unit becomes self-sustaining. Using the best financial tools for franchise owners helps you visualize this dip so you don't run out of gas during the ramp-up. What this estimate hides is the potential for unexpected construction delays that could extend your pre-opening burn.
This financial model template for snack shop franchise allows you to toggle between Low, Medium, and High scenarios to see the impact on your $810,000 base revenue. Preparing a financial plan for a new franchise location requires seeing how a 10% drop in traffic affects your ability to pay the 7% royalty. A High scenario significantly shortens your path to the $378,000 Year 5 EBITDA target.
This franchise financial model is built in Excel to give you total control over your numbers. You can swap out pre-filled formulas and edit assumptions to match your specific territory, local labor rates, and real estate costs. It is designed to be a flexible tool for any retail operator needing a reliable way to test different business scenarios before signing a lease.

Planning for the long term is the only way to survive in retail, so we included a full 5-year outlook. This franchise unit cash flow projection template maps out your growth from a $810,000 Year 1 to a $1.415 million Year 5. You can track how annual revenue increases and expense shifts impact your bottom line as the unit matures.

The model handles the heavy lifting for a royalty fee calculation by applying a 7% rate and a 3% marketing fund contribution automatically. Analyzing franchise royalty and marketing fees in Excel helps you see the actual cash remaining after these brand obligations are met. This ensures you understand the store-level margin before paying your local bills.

Use this as your franchise startup cost calculator to account for the $35,500 initial fee and $220,000 in leasehold improvements. The break-even analysis identifies exactly when your sales volume covers the $14,000 monthly fixed rent and CAM fees. Knowing how to calculate startup costs for a food franchise correctly prevents mid-project funding gaps.

Our retail franchise profitability analysis includes standard benchmarks to help you sanity-check your food and labor costs. If your ingredient costs drift far from the 11.5% target, the model flags it so you can investigate waste or portion control. This ROI analysis keeps your expectations grounded in the reality of high-volume snack shop operations.


Simply purchase and download the financial model template, then access it instantly using Microsoft Excel or Google Sheets. No installation or technical expertise required-just open and start working.

Enter your business-specific numbers, including revenue projections, costs, and investment details. The pre-built formulas will automatically calculate financial insights, saving you time and effort.

Leverage the investor-ready format to confidently showcase your financial projections to banks, franchise representatives, or investors. Impress stakeholders with clear, data-driven insights and professional reports.

Leverage the investor-ready format to confidently present your projections to banks, franchise representatives, or investors.