
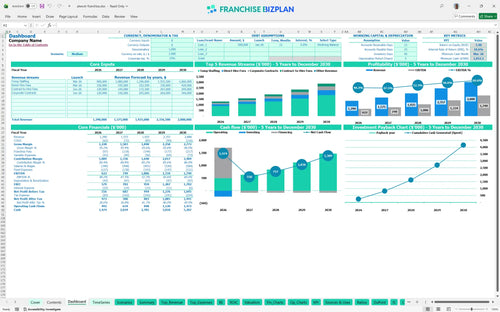
All-in-one Dashboard
Core inputs and core outputs


This comprehensive staffing franchise financial model provides a complete toolkit for forecasting revenue, managing expenses, and calculating investor returns for a new recruitment unit.
Core inputs and core outputs
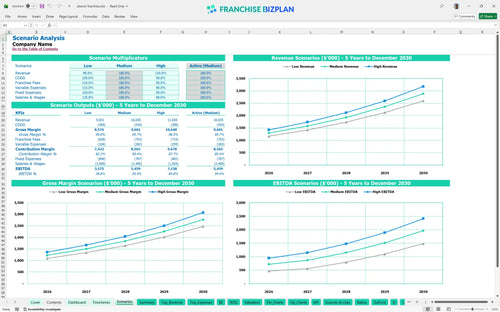
Three scenario analysis
Presentation ready
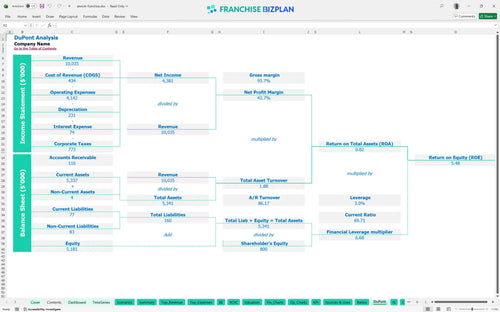
DuPont analysis
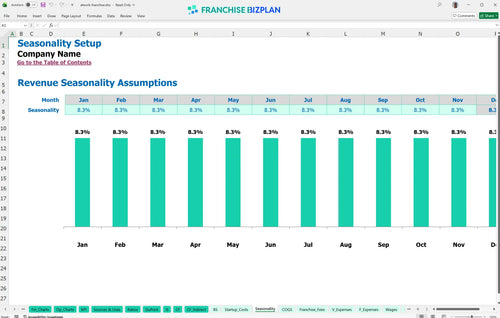
Researched revenue assumptions
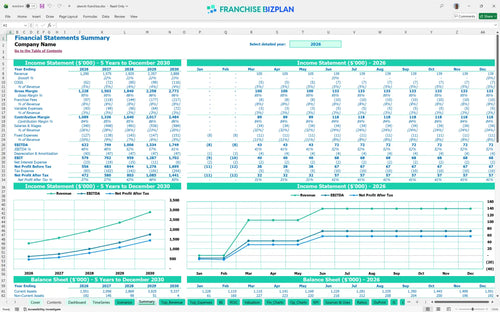
Lender-friendly financial outputs
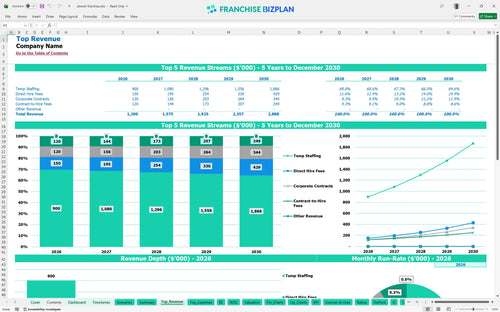
Revenue stream detailed view
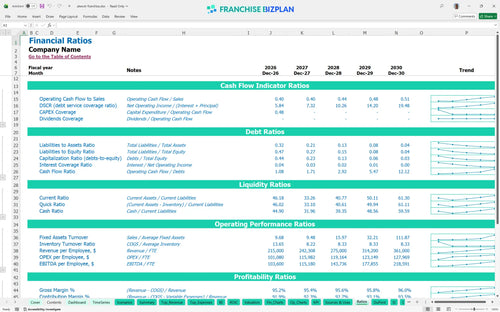
Performance metrics benchmark
We built this franchise unit financial model using our own research to help you navigate the staffing industry profit margins. Key assumptions like the $1.29 million year-one revenue and the 18.59% IRR (internal rate of return) are pre-populated and fully editable to fit your local market. This data-driven approach defintely helps you build a credible business plan. Data beats guessing every time.
The unit reaches profitability in its first year, with EBITDA (earnings before interest, taxes, depreciation, and amortization) starting at $622,000 and scaling to $1.74 million by year five. This trajectory assumes you successfully ramp up temp staffing and direct hire fees while managing a 7% royalty burden. Margin is vanity, profit is sanity.
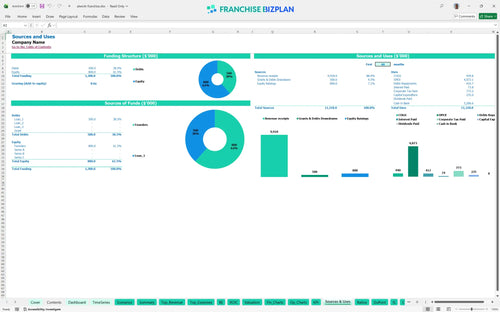
You need approximately $235,000 in capital expenditures (CAPEX) to launch, which covers the $40,000 franchise fee, $65,000 for office improvements, and $35,000 for computer equipment. This doesn't include your initial working capital buffer needed to carry payroll before client payments arrive. Cash is king, but allocation is the kingdom.
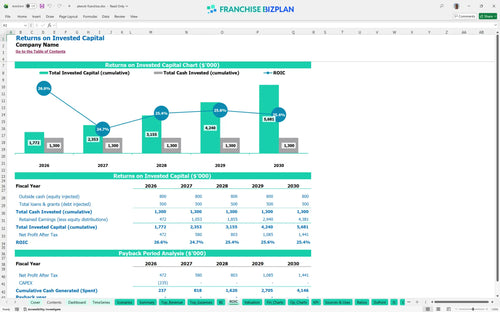
A typical unit shows an IRR of 18.59% and a return on equity of 5.48, though the full payback of the initial investment occurs after year five. These metrics reflect a stable, long-term service business rather than a get-rich-quick scheme. Patience pays when the IRR is solid.
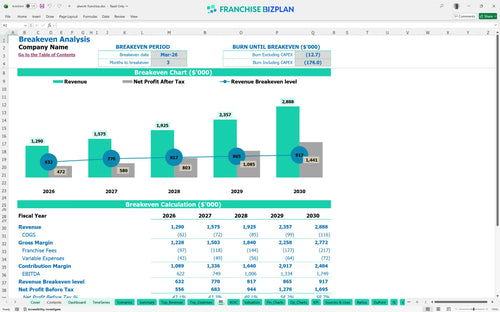
The model shows a monthly break-even point in March 2026, just three months after launching operations. Reaching this milestone depends heavily on hitting your temp staffing volume targets and keeping your $6,500 monthly rent in check. Efficiency is the shortest path to zero-cost.
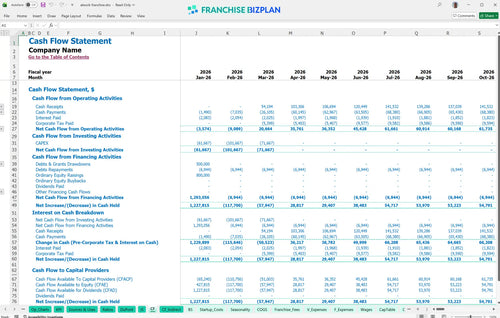
Your lowest cash point occurs in March 2026 at $1,052,000, suggesting you need a significant liquidity reserve to handle the timing gap between paying recruiters and collecting from clients. Maintaining this runway is critical during the first six months of the ramp-up. Liquidity is your best friend in year one.
The high-growth scenario relies on securing scalable corporate contracts and improving recruiter productivity to push revenue toward the $2.88 million mark. If revenue lags by 20%, your year-one EBITDA will tighten significantly, delaying your ability to reinvest in new staff. Plan for the worst, execute for the best.
Finance: update unit break-even and payback model by Friday
This staffing franchise financial model is built in Excel to give you total control over your projections. You can adjust pre-filled formulas and editable assumptions to match your specific territory, whether you are in a high-density metro or a suburban industrial hub. Control your numbers or they will control you.

Plan for the long haul with detailed franchise financial projections that track your growth from $1.29 million in year one to $2.88 million by year five. This view helps you manage the transition from a single-unit operator to a mature business owner with a clear view of your future balance sheet. Growth is a marathon, not a sprint.

This tool tracks every dollar owed to the franchisor, including the 7% royalty fee and the 0.5% marketing fund contribution. By modeling these costs against your gross margin, you can see exactly how brand obligations impact your bottom-line cash flow before you sign a lease. Royalties are the price of brand power.

Estimate your total staffing agency startup costs, including the $40,000 initial fee and $65,000 for leasehold improvements. The model calculates the exact sales volume needed to cover your fixed costs, which is vital for managing your early-stage risk. Speed to break-even is the best risk mitigator.

Use built-in industry standards to sanity-check your recruitment agency financial planning and ensure your labor costs stay competitive. Comparing your expected performance against typical gross margin ranges helps you spot red flags in your business plan before they become expensive mistakes. Benchmarks keep your ego in check.


Simply purchase and download the financial model template, then access it instantly using Microsoft Excel or Google Sheets. No installation or technical expertise required-just open and start working.

Enter your business-specific numbers, including revenue projections, costs, and investment details. The pre-built formulas will automatically calculate financial insights, saving you time and effort.

Leverage the investor-ready format to confidently showcase your financial projections to banks, franchise representatives, or investors. Impress stakeholders with clear, data-driven insights and professional reports.

Leverage the investor-ready format to confidently present your projections to banks, franchise representatives, or investors.