


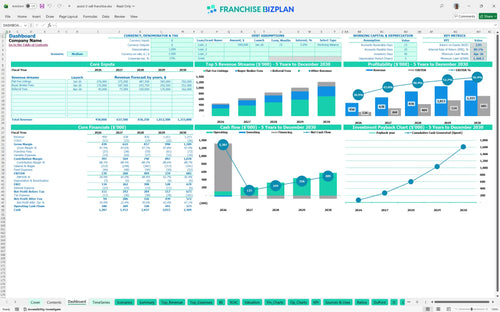
All-in-one Dashboard
Core inputs and core outputs



This franchise financial model template provides a complete toolkit for estimating profitability for flat-fee real estate models, including dynamic revenue tiers and agent hiring schedules. This is the engine under the hood of your business plan.
Core inputs and core outputs
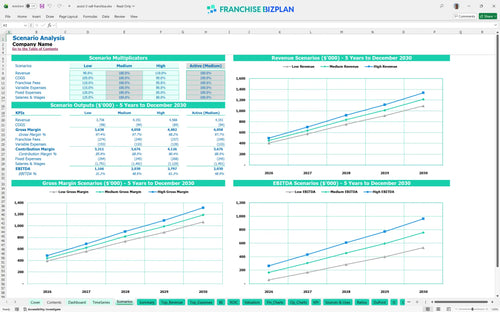
Three scenario analysis
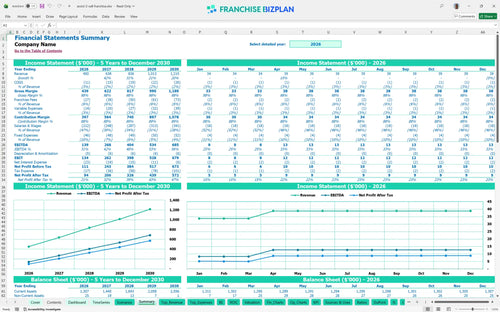
Presentation ready

DuPont analysis
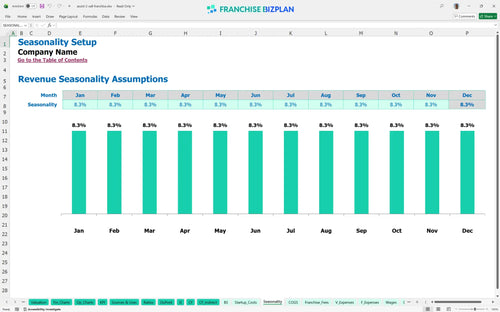
Researched revenue assumptions

Lender-friendly financial outputs

Revenue stream detailed view
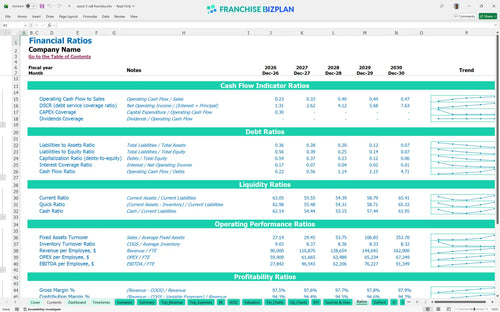
Performance metrics benchmark
We built this real estate brokerage financial model spreadsheet using deep-dive research into flat-fee brokerage operations. The model comes pre-loaded with specific data points like a $2,995 franchise fee and a Year 1 EBITDA of $139,000, but you can edit every line to fit your vision. It is a practical tool for any owner looking to master their franchise unit budget and cash flow projections. Data beats guesswork every single time.
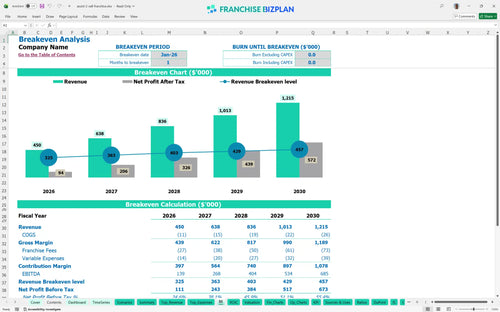
Based on the data, this unit hits break-even incredibly fast, reaching the point where revenue covers all operating costs within the first month of operation in January 2026. While year one EBITDA starts at $139,000, the real acceleration happens in years three and four as referral fees and buyer broker fees scale. Profitability is about volume and discipline.
You need roughly $30,000 to get the doors open, covering everything from the $2,995 franchise fee to the $8,500 office fit-out. This startup financial model for brokerage expansion and capital expenditure planning also accounts for a significant cash buffer, as the minimum cash position is modeled at $1,268,000 to ensure long-term stability. Capital is the fuel for your brokerage engine.
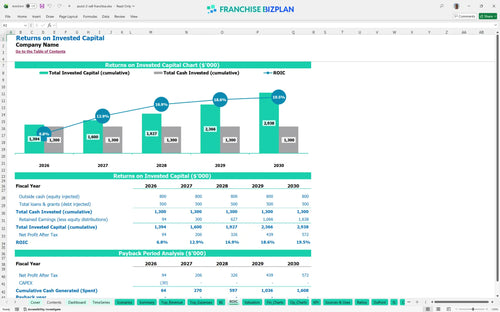
The model shows a very strong Internal Rate of Return (IRR) of 80.09%, which is high for the service sector. Calculating ROI for real estate franchise investment here shows a Return on Equity (ROE) of 2.05, though the full payback of all capital occurs after year five due to the high cash reserves maintained. Returns are the ultimate scorecard for any operator.
Monthly break-even is achieved almost immediately because the fixed costs-like the $2,800 Mueller rent and $300 utilities-are low relative to the high-margin nature of flat-fee commissions. The biggest lever for maintaining this is agent productivity and transaction mangement; you start with 2.5 agents and scale to 4.5. Speed to break-even reduces your personal risk.
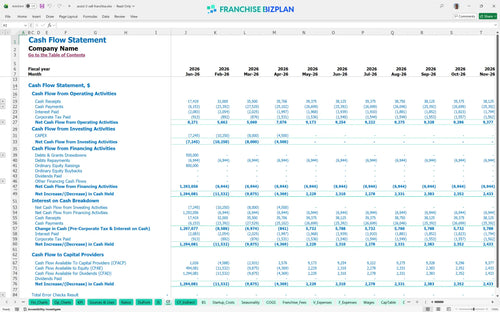
Your lowest cash point occurs in April 2026, just a few months after launch, at $1,268,000 including initial funding. To protect your cash flow, you should monitor the timing of the $4,500 initial marketing spend against the ramp-up of flat-fee listing revenue. Financial planning for new real estate office locations requires watching this gap closely. Cash is oxygen for a new office.
The difference between a 'Low' and 'High' case in this real estate franchise business plan usually comes down to lead conversion and local market velocity. Analyzing recurring revenue in real estate franchise units through referral fees can help stabilize the 'Low' case when the broader market slows down, while the 'High' case accelerates your climb to the $1.2M revenue mark. Scenarios prepare you for whatever the market throws your way.
Finance: update unit break-even and payback model by Friday.
This franchise unit financial model template lives in Excel, so you can tweak every variable to match your specific territory. Whether you are adjusting the flat fee for listings or changing agent commission splits, the pre-filled formulas handle the heavy lifting. It is a real estate brokerage pro forma that lets you swap out Mueller district rent for your local market rates without breaking the math. It turns complex brokerage math into a simple decision-making tool.

Planning for a single office or a small chain requires seeing past the first twelve months. This financial projection template for franchises maps out five years of performance, showing how revenue scales from $450,000 in year one to over $1.2M by year five. You will see exactly how franchise unit profitability analysis tracks as you add more licensed agents to the roster. Growth is a marathon, not a sprint.

Most models ignore the 'off-the-top' costs that eat your margin, but this one bakes in the franchise royalty fee structure from day one. With a 5% royalty and 1% marketing fee, you need to know how those payments impact your net take-home as volume grows. This tool ensures you are defintely accounting for every dollar sent to corporate before you calculate your own draw. Royalties are a fact of life; don't let them be a surprise.

Knowing how to calculate startup costs for a real estate franchise is the difference between a smooth launch and a cash crunch. This franchise startup cost calculator and break-even analysis tool totals your fit-out, signage, and initial marketing materials-about $30,000 in this scenario-to find your floor. It identifies the exact number of flat-fee listings needed each month to cover your $2,800 rent and $4,000 in monthly fixed overhead. Knowing your floor is the first step to reaching your ceiling.

We have loaded this Excel template for franchise unit financial forecasting with realistic benchmarks so you aren't guessing in the dark. If your digital advertising costs hit 2.2% of revenue or your MLS dues climb, you can see how you stack up against typical brokerage standards. It helps you sanity-check your operational cost forecasting against real-world data from the Austin market and beyond. Benchmarks keep your projections grounded in reality.


Simply purchase and download the financial model template, then access it instantly using Microsoft Excel or Google Sheets. No installation or technical expertise required-just open and start working.

Enter your business-specific numbers, including revenue projections, costs, and investment details. The pre-built formulas will automatically calculate financial insights, saving you time and effort.

Leverage the investor-ready format to confidently showcase your financial projections to banks, franchise representatives, or investors. Impress stakeholders with clear, data-driven insights and professional reports.

Leverage the investor-ready format to confidently present your projections to banks, franchise representatives, or investors.