
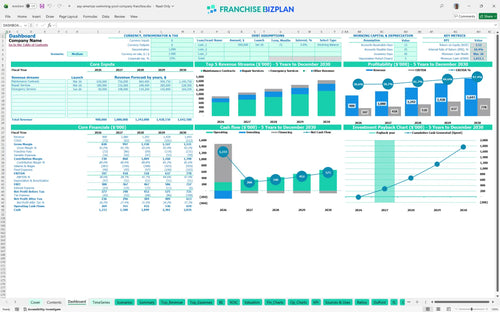
All-in-one Dashboard
Core inputs and core outputs


The Excel template for franchise unit business plan includes a comprehensive ROI calculator, 5-year income statements, and a detailed breakdown of startup expenses for a professional swimming pool maintenance company.
Core inputs and core outputs
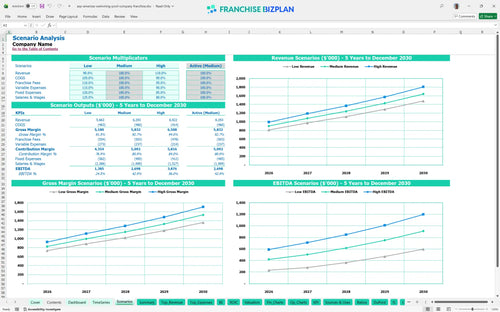
Three scenario analysis
Presentation ready
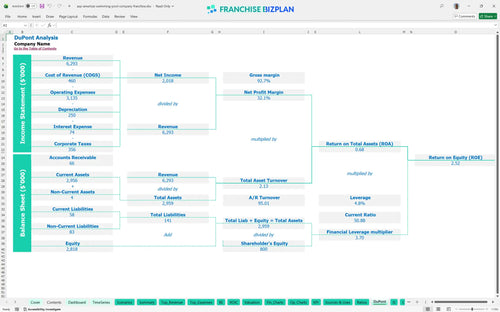
DuPont analysis
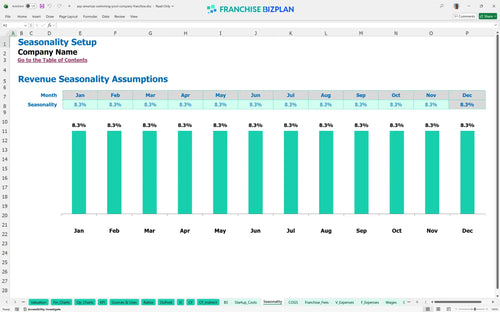
Researched revenue assumptions
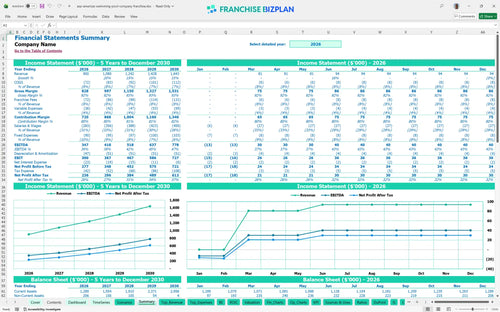
Lender-friendly financial outputs
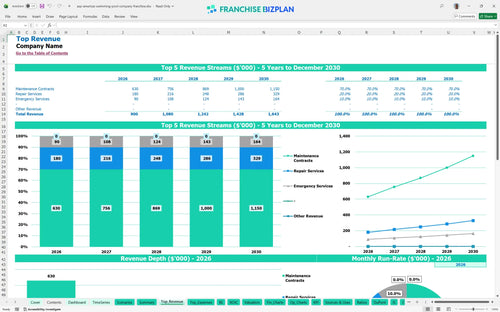
Revenue stream detailed view
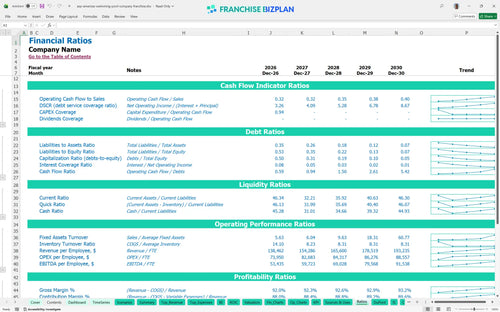
Performance metrics benchmark
We built this ASP - America's Swimming Pool Company Franchise Franchise Unit Financial Model using deep research into the pool service sector. The model comes pre-loaded with a $900,000 year-one revenue target and specific costs like the $65,000 operations manager salary, but you can edit every single number to fit your local reality. It is a practical tool for projecting equipment and labor costs for pool franchises while keeping an eye on the 10.38% internal rate of return.
This unit hits profitability almost immediately due to the high-margin recurring revenue business model, showing a positive EBITDA of $347,000 in the first year. By year two, the net profit continues to climb as you leverage the fixed costs of your headquarters and management staff. Efficiency is the name of the game here.
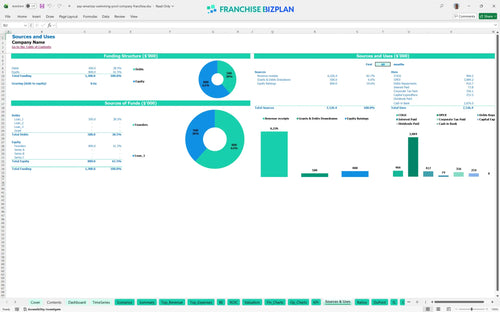
You will need approximately $253,500 to get this unit off the ground, which covers the franchise fee and the essential physical assets. This pool maintenance franchise profit and loss projection assumes you are starting with a professional fleet and the right tools to handle luxury estates. Most of your cash goes into the brand entry and the mobile service units.
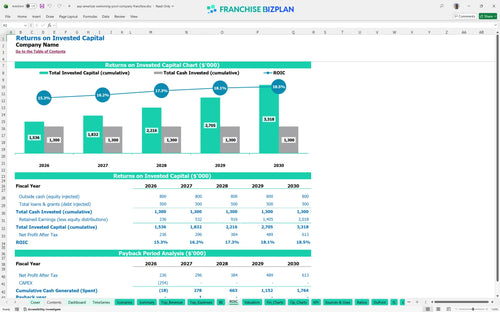
The model shows a 10.38% internal rate of return (IRR) and a 2.52 return on equity (ROE), which is solid for a service-based business. With a 2-year payback period, you recover your initial investment relatively quickly compared to brick-and-mortar retail. Building a financial plan for a home service franchise like this focuses on that rapid cash recovery.
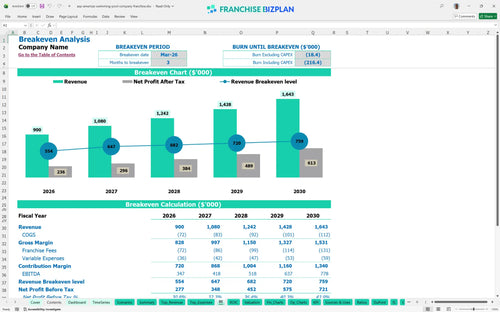
The monthly break-even point occurs in March 2026, just three months after the initial launch. This quick turnaround is driven by the $420,000 in maintenance contracts expected in the first year. Your biggest hurdle is covering the fixed management salaries and fleet insurance before the recurring contract base matures.
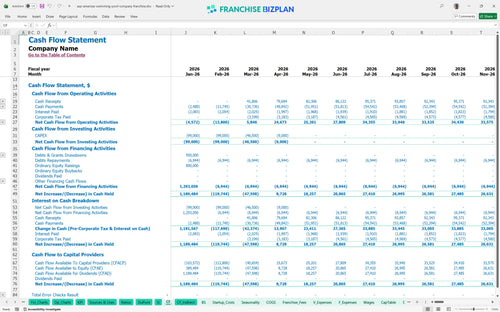
The lowest cash point occurs in March 2026 at $1,022,000, assuming you start with sufficient initial funding to cover the $253,500 in startup costs. You need enough runway to handle the gap between paying technicians and collecting on those first repair invoices. Still, the recurring nature of the revenue makes cash flow more predictable than one-off construction projects.
The high scenario significantly boosts your year-one margin by increasing the average ticket on repair services and emergency calls. If revenue drops 10% in a low scenario, your payback period might stretch toward three years, but the recurring maintenance contracts provide a safety net. Estimating recurring revenue for pool cleaning businesses is the best way to stress-test these outcomes.
Finance: update unit break-even and payback model by Friday
This pool service franchise financial model is a fully editable Excel tool designed for precision. You can swap out pre-filled assumptions for your specific territory, whether you are looking at labor rates in Scottsdale or rent in a different market. The formulas are unlocked, so you can adjust the revenue and pricing drivers to see how a small shift in your monthly service fee changes the bottom line. It is defintely the fastest way to build a professional pool cleaning franchise profitability analysis without starting from a blank sheet.

Planning for the long haul is the only way to survive the seasonal swings of the pool industry. This franchise business financial projections template maps out a 5-year path, starting at $900,000 in year one and scaling to over $1.64 million by year five. It gives you a clear view of how recurring revenue from maintenance contracts builds over time. Honestly, seeing the multi-year EBITDA growth from $347,000 to $778,000 helps you decide when to add that next branded truck to the fleet.

Franchise systems have specific costs that can eat your margin if you don't track them right. This model handles the 7% royalty and 1% marketing fund contributions automatically based on your sales volume. We also factored in the initial $90,000 franchise fee so you can see the full impact on your day-one cash position. Analyzing franchise royalty fees and operational costs upfront ensures you know exactly how much of every dollar stays in your pocket after the franchisor gets their cut.

Knowing how to calculate startup costs for a pool service franchise is the first step to securing funding or committing your own capital. The model breaks down the $253,500 initial investment, covering everything from the office fit-out to pool service equipment. It also identifies your break-even point, which in this case hits just three months after launch in March 2026. This allows you to plan your working capital needs so you aren't caught off guard during the ramp-up phase.

We used real-world data to set the baseline for this financial forecasting template for residential service franchises. For example, pool chemicals are pegged at 5.5% of revenue, and fuel costs start at 2.5%. These benchmarks act as a sanity check for your operating expenses for service franchises. If your actual chemical spend is double the benchmark, you know you have a waste or theft issue at the store level. Every 1-point margin leak matters fast in a service-based model.


Simply purchase and download the financial model template, then access it instantly using Microsoft Excel or Google Sheets. No installation or technical expertise required-just open and start working.

Enter your business-specific numbers, including revenue projections, costs, and investment details. The pre-built formulas will automatically calculate financial insights, saving you time and effort.

Leverage the investor-ready format to confidently showcase your financial projections to banks, franchise representatives, or investors. Impress stakeholders with clear, data-driven insights and professional reports.

Leverage the investor-ready format to confidently present your projections to banks, franchise representatives, or investors.