
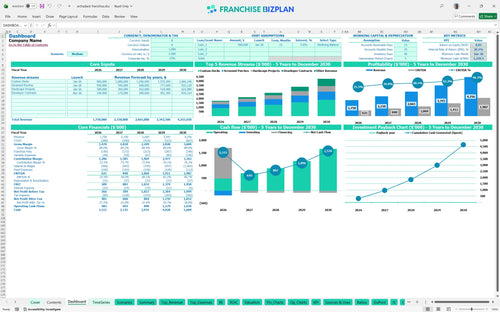
All-in-one Dashboard
Core inputs and core outputs


This comprehensive financial model provides a complete toolkit for forecasting revenue, managing expenses, and calculating the long-term ROI of an outdoor construction franchise unit.
Core inputs and core outputs
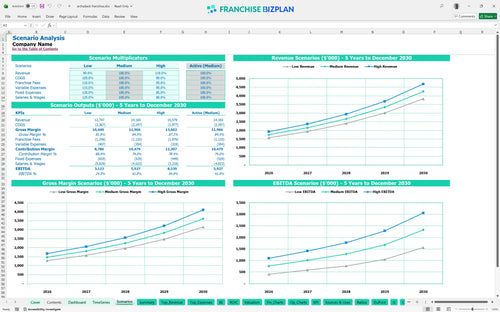
Three scenario analysis
Presentation ready
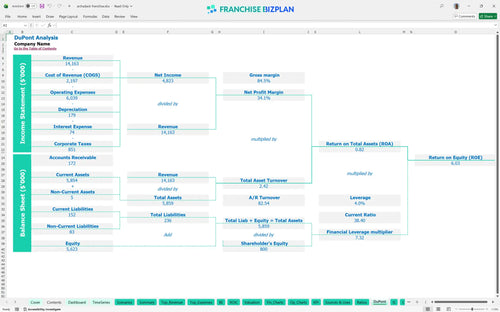
DuPont analysis
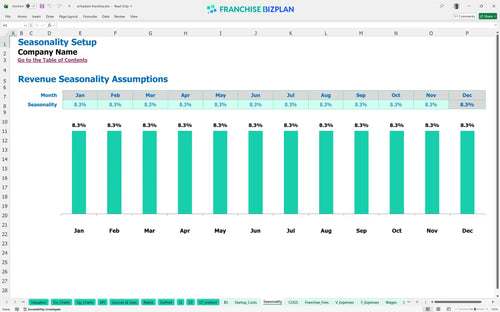
Researched revenue assumptions
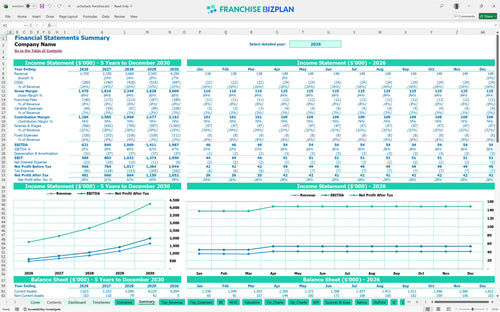
Lender-friendly financial outputs
Revenue stream detailed view
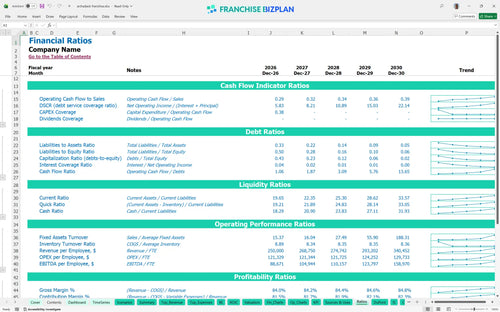
Performance metrics benchmark
We built this franchise unit financial model using deep research into the outdoor living and custom construction sector. Key assumptions, including the $1.75M year-one revenue target and the 6.5% royalty structure, are pre-populated and fully editable to fit your specific market. This model provides a pragmatic look at the numbers, showing an initial EBITDA of $621,000 and a path to significant scaling over five years.
This unit becomes profitable in its very first year, with a projected EBITDA of $621,000. Evaluating profitability of a deck building franchise requires looking past the high ticket price to the 12% material costs and 4% subcontractor fees. By year five, the model shows net profit scaling to nearly $2 million as you optimize your crew's throughput and leverage developer contracts. Honestly, the high margins are achievable only if you maintain strict control over your construction foreman's schedule.
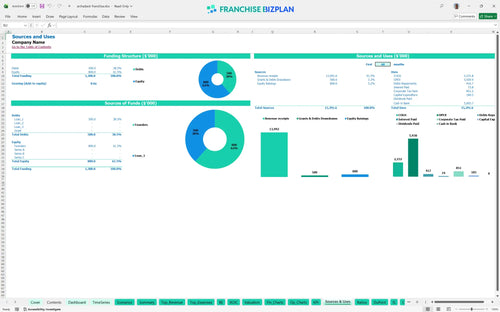
You will need approximately $184,500 in upfront capital to cover the franchise fee, design center improvements, and essential equipment like 3D modeling software and a company vehicle. This startup budget template for custom home exterior business also accounts for a significant cash buffer, as the model indicates a minimum cash requirement of $1,240,000 to manage large-scale project cycles. Capital expenditure planning is vital here because high-end builds require significant upfront material outlays before progress payments kick in.
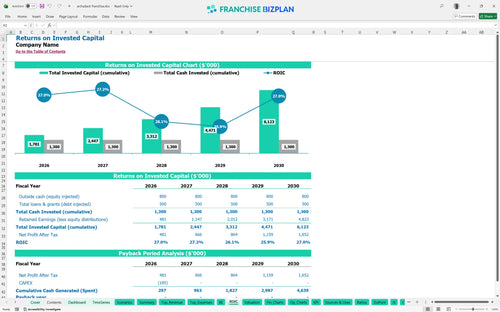
The ROI calculation for this unit is impressive, featuring an Internal Rate of Return (IRR) of 38.09%. While the full payback period extends beyond five years due to the heavy reinvestment in working capital and staff, the annual cash flow becomes a major asset by year three. This franchise financial projection spreadsheet for entrepreneurs shows that while you start with a $1.2M cash floor, the equity value of a $4.2M revenue business is substantial. Still, your actual return depends defintely on your ability to manage the project manager's efficiency.
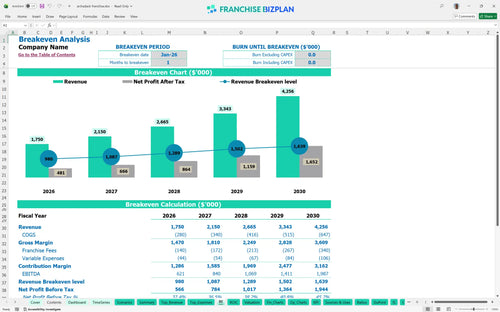
The model projects a break-even date in January 2026, which is the first month of active operations. This assumes you hit the ground running with a sales manager and design consultant already closing deals in the pipeline. Estimating operating costs for a design-build franchise shows that your fixed costs, including $4,500 for the design center and $1,200 for utilities, are relatively low compared to the revenue potential of a single custom deck project. Your primary break-even driver is sales volume and maintaining a high average ticket.
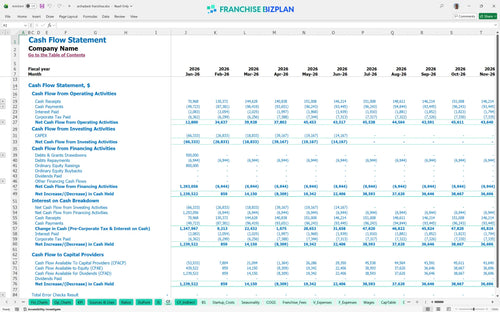
Your lowest cash point is $1,240,000 in January 2026, which represents the total liquidity needed to safely launch and ramp up. This cash flow projection template highlights that while you are profitable early, the 'gap' between paying for materials and receiving final client checks can strain your runway. We recommend maintaining a six-month buffer of fixed expenses to handle any permit delays or weather-related construction pauses. Plus, having cash on hand allows you to take on larger developer contracts that often have longer payment terms.
Revenue forecasting for home improvement franchise units must account for market volatility. In the High scenario, aggressive local marketing and developer partnerships could push year-five revenue past $5 million, significantly shortening your payback period. Conversely, the Low scenario shows how a 20% dip in custom deck sales impacts your ability to cover the 8% total franchise and marketing fees. The model allows you to stress-test your labor costs, showing that even in a Medium scenario, the 38% IRR remains robust if you control variable expenses.
This franchise financial model template is a fully editable Excel tool that allows you to swap out every assumption to match your specific territory. It comes pre-loaded with formulas that link your revenue drivers directly to your cash flow, so you can see how a change in project volume impacts your bottom line. Whether you are adjusting crew wages or local rent, the model updates instantly to keep your planning accurate. Every cell is open, meaning no hidden calculations or locked sheets will get in your way.

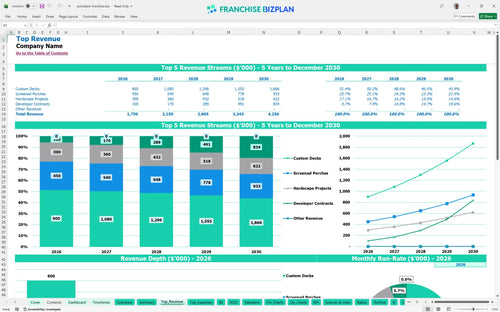
You get a detailed 5-year outdoor living franchise financial forecast that maps your growth from a single crew to a multi-team operation. The model projects revenue starting at $1.75 million in year one and scaling to over $4.25 million by year five based on researched performance data. This construction franchise business plan view helps you anticipate when to hire your second project manager or when to invest in more vehicles. It provides a clear roadmap for scaling without running out of steam.

Managing the franchise royalty fee structure is simple with built-in calculators for both the 6.5% royalty and the 1.5% marketing fund contribution. These fees are automatically deducted from your gross sales, giving you a realistic view of your store-level EBITDA before you ever sign a lease. Understanding royalty and marketing fees in franchising is critical because they represent a permanent 'tax' on your top line that must be offset by high-margin custom builds. This model ensures you never overlook these recurring obligations.

This tool shows you exactly how to calculate startup costs for a construction franchise, covering everything from the $59,500 initial fee to the $35,000 company vehicle. By mapping out these home improvement franchise startup costs, you can identify the exact month your cumulative gross profit covers your initial investment. The break-even analysis is tied to your average ticket size, helping you see how many custom decks you need to sell each month to stay in the black. It turns vague estimates into a concrete survival plan.

The unit economics model comes with built-in benchmarks for labor, materials, and occupancy to ensure your projections stay grounded in reality. For example, if your building materials exceed 12% of revenue, the model helps you identify where the margin leak is happening. This franchise profitability analysis tool allows you to compare your expected performence against typical industry standards for design-build firms. It acts as a sanity check for your business plan, ensuring your labor costs and rent stay within healthy ranges for a high-end exterior business.


Simply purchase and download the financial model template, then access it instantly using Microsoft Excel or Google Sheets. No installation or technical expertise required-just open and start working.

Enter your business-specific numbers, including revenue projections, costs, and investment details. The pre-built formulas will automatically calculate financial insights, saving you time and effort.

Leverage the investor-ready format to confidently showcase your financial projections to banks, franchise representatives, or investors. Impress stakeholders with clear, data-driven insights and professional reports.

Leverage the investor-ready format to confidently present your projections to banks, franchise representatives, or investors.