
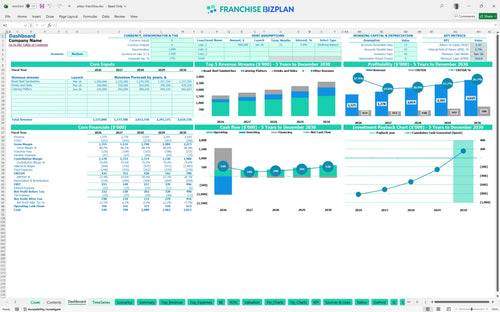
All-in-one Dashboard
Core inputs and core outputs


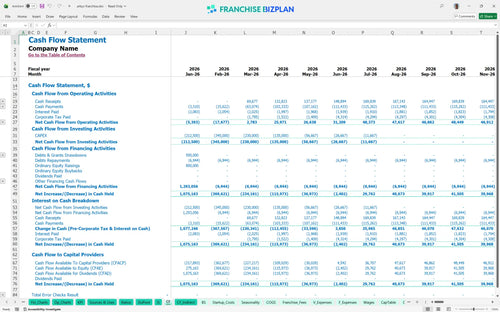
This tool provides a complete franchise unit cash flow projection spreadsheet including dynamic CAPEX tracking, multi-year P&L statements, and scenario-based ROI calculators.
Core inputs and core outputs
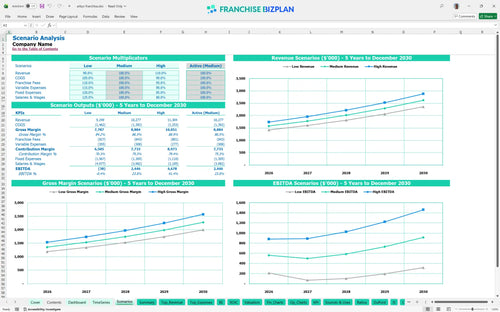
Three scenario analysis
Presentation ready
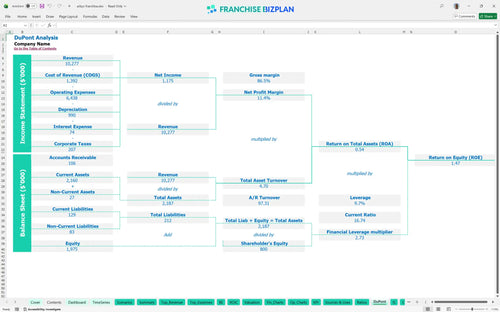
DuPont analysis
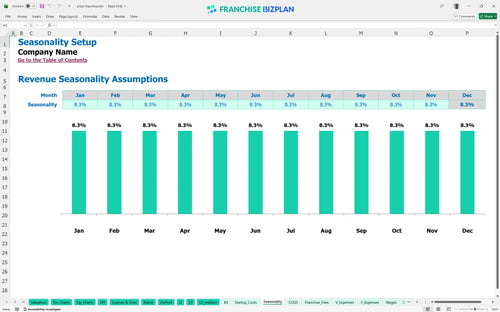
Researched revenue assumptions
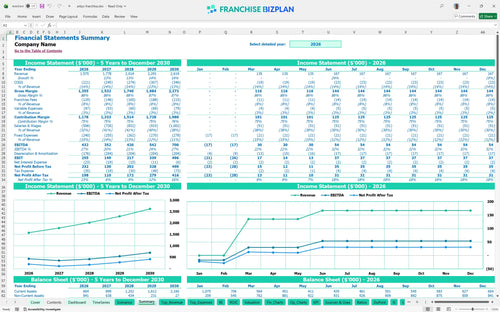
Lender-friendly financial outputs
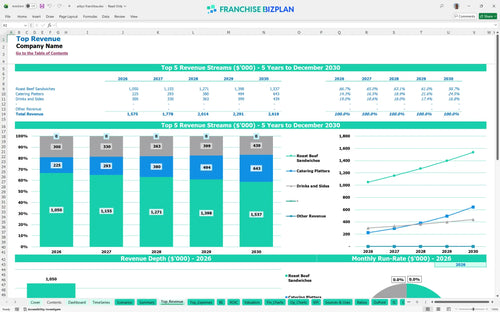
Revenue stream detailed view
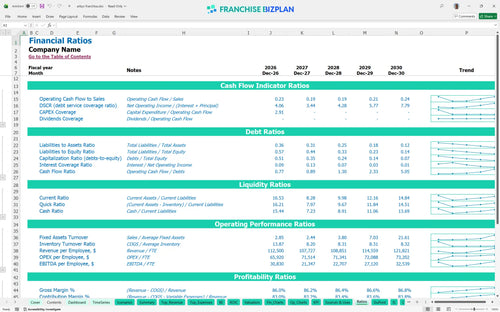
Performance metrics benchmark
We built this fast food franchise financial model using research on high-volume roast beef QSR units. Key assumptions like the 4% royalty and $1.57M year-one revenue are pre-filled and fully editable. This tool simplifies financial forecasting for restaurant franchise units by mapping out everything from roast beef sales to AI kitchen setup costs.
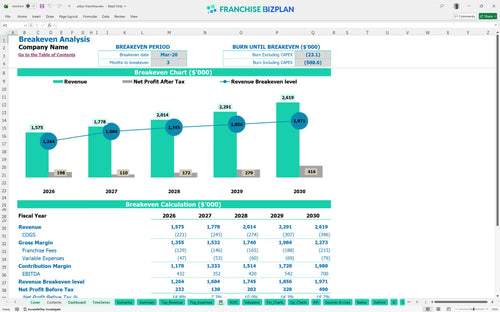
The model shows a fast start with a breakeven date in March 2026, just three months after launch. By year five, annual EBITDA is projected to hit $700,000 as catering platters scale to $428,000 in sales. Every dollar of revenue counts when you are analyzing profitability of a drive-thru restaurant.
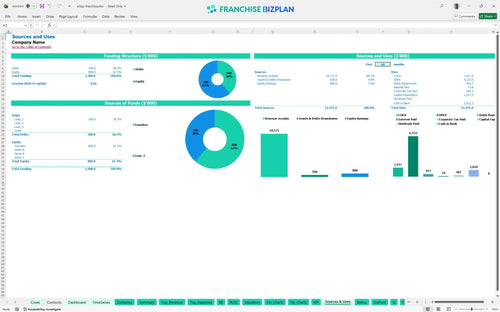
You need roughly $1.02M to get the doors open, covering the $37,500 franchise fee and significant build-out costs. This startup costs for a new QSR franchise location analysis includes a $316,000 minimum cash reserve to handle the ramp-up phase. Here is the quick math: leaseholds and kitchen gear eat 55% of your budget.
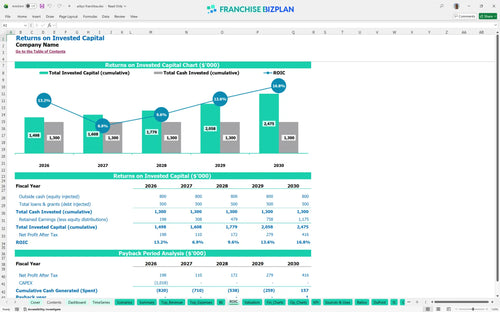
This template for restaurant franchise budget planning projects a 5-year payback period and an IRR of 2.68%. While the IRR appears conservative, the 1.47 ROE suggests steady equity growth as the unit matures and debt is serviced. What this estimate hides is the potential for higher returns through multi-unit overhead sharing.
You hit the break-even point in month 3, driven largely by the $700,000 initial roast beef sandwich volume. The biggest drag on your break-even is the $15,000 monthly rent, which requires high throughput to cover. You must keep the drive-thru moving to stay ahead of fixed costs.
Your lowest cash point is $316,000 in June 2026, about four months after opening. This reflects the gap between initial sales ramp and the final payments for signage and AI software setup. Still, having a buffer is critical if how to calculate ROI for a fast food franchise is your main goal.
A 10% drop in revenue significantly delays your 5-year payback, while the high case sees EBITDA climb toward the $800k mark sooner. Evaluating franchise operating margins and overhead across these scenarios ensures you are not caught off guard by a slow start. High-volume catering is the fastest way to hit the high-case scenario.
Finance: update unit break-even and payback model by Friday.
This fast food franchise financial model lives in Excel, meaning you own the logic. Every formula is open, allowing you to swap out the $15,000 monthly rent or adjust the 12% food cost as local prices shift. It is a franchise unit business plan template designed for real-world stress testing, not just a static projection.

Success in QSR franchise financial projections requires looking past the grand opening. This model tracks your climb from $1.57M in year one to over $2.6M by year five. You will see how EBITDA scales from $432,000 to $700,000 as you refine throughput and capture more catering revenue.

Royalty fees and marketing funds are the franchise tax that buys you brand power. This model calculates the 4% royalty and 4.2% marketing fee automatically against your gross sales. Understanding these outflows is vital for analyzing profitability of a drive-thru restaurant where margins are won or lost in the middle of the P&L.

Use this franchise startup cost calculator to visualize where your $1M+ investment goes. From the $350,000 in leasehold improvements to the $180,000 for drive-thru tech, every dollar is accounted for. The break-even analysis shows you exactly when the unit stops burning cash and starts generating a return.

Don't fly blind when estimating labor costs for a quick service restaurant. We have baked in industry-standard ranges for crew wages and food costs, defintely helping you spot if your $30,000 crew salaries are out of alignment. Use these benchmarks to sanity-check your restaurant franchise profitability analysis before signing a lease.


Simply purchase and download the financial model template, then access it instantly using Microsoft Excel or Google Sheets. No installation or technical expertise required-just open and start working.

Enter your business-specific numbers, including revenue projections, costs, and investment details. The pre-built formulas will automatically calculate financial insights, saving you time and effort.

Leverage the investor-ready format to confidently showcase your financial projections to banks, franchise representatives, or investors. Impress stakeholders with clear, data-driven insights and professional reports.

Leverage the investor-ready format to confidently present your projections to banks, franchise representatives, or investors.