
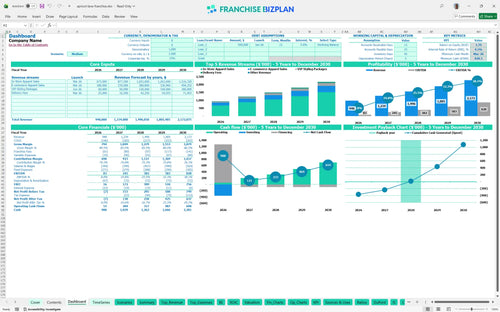
All-in-one Dashboard
Core inputs and core outputs


This Excel template for franchise unit financial planning contains integrated pro forma statements, automated CAPEX schedules, and detailed payroll calculators for a retail environment.
Core inputs and core outputs
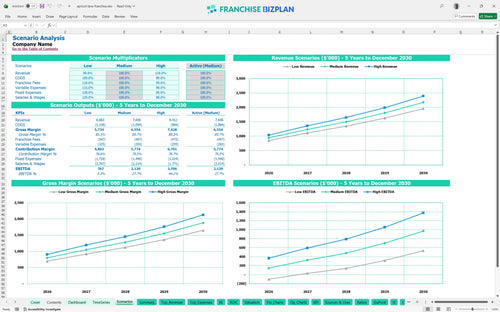
Three scenario analysis
Presentation ready
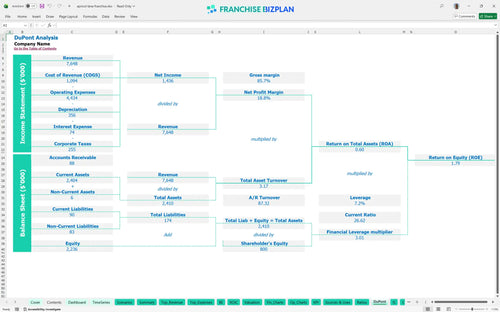
DuPont analysis
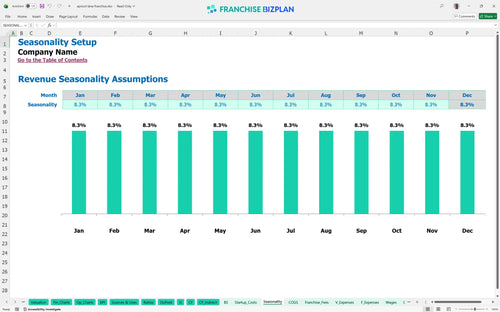
Researched revenue assumptions
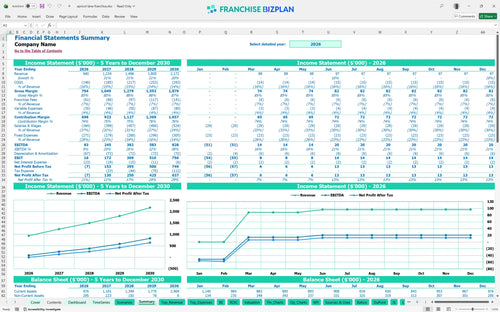
Lender-friendly financial outputs
Revenue stream detailed view
Performance metrics benchmark
We built this boutique franchise financial projections model using real-world retail data to reflect the actual costs of high-end boutique operations. Key assumptions like the $39,500 franchise fee and $18,000 monthly rent are pre-populated but fully editable to match your specific territory. With year one revenue projected at $940,000 and EBITDA hitting $83,000, the model provides a realistic starting point for your retail franchise business plan.
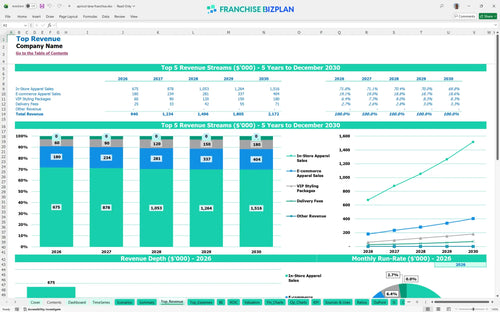
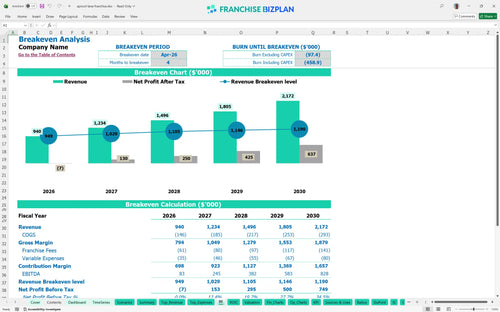
This unit reaches profitability in its first year, with EBITDA scaling from $83,000 to $828,000 by year five. The model accounts for a 4-month breakeven period, meaning you need to manage your boutique franchise operating budget template tightly during the initial ramp-up. Profitability depends on scaling in-store apparel sales from $450,000 to over $1 million by year five.
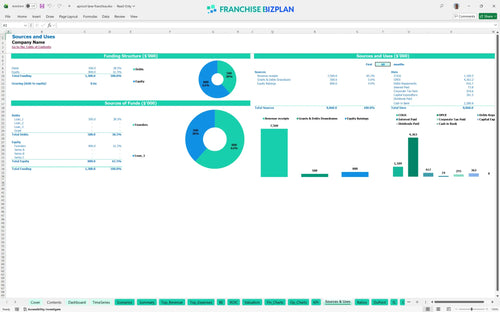
Launching this unit requires a significant upfront investment, including a $39,500 franchise fee and $120,000 for leasehold improvements. The total franchise unit startup capital requirements template includes $80,000 for initial inventory and $60,000 for fixtures to ensure the store meets brand standards. Total initial cash outlay must cover these CAPEX (capital expenditure) items plus a working capital buffer.
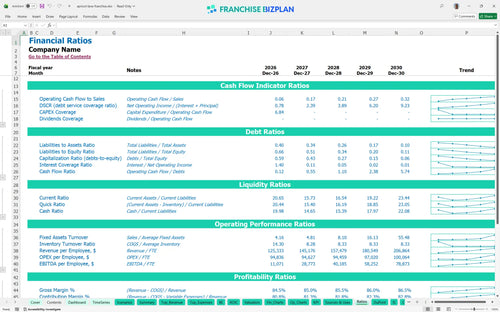
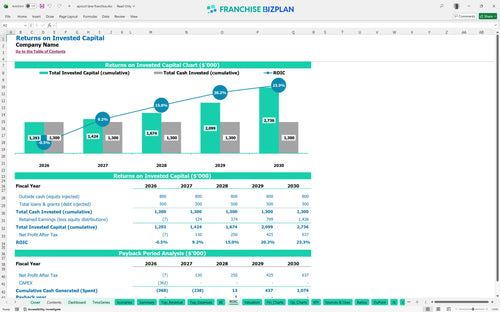
Investors can expect an Internal Rate of Return (IRR) of 4.48% and a Return on Equity (ROE) of 1.79. This franchise ROI calculator shows a 3-year payback period, which is standard for high-end retail build-outs in prime locations. The long-term value is driven by the 5-year revenue growth and the ability to maintain a 12.5% inventory cost as you scale.
The unit hits its monthly break-even point in April 2026, just four months after launching. Estimating profitability for a new franchise location depends heavily on maintaining the $18,000 monthly rent and managing the 14.5% apparel COGS (Cost of Goods Sold). If sales dip below the $940,000 annual target in year one, the break-even date will push further out.
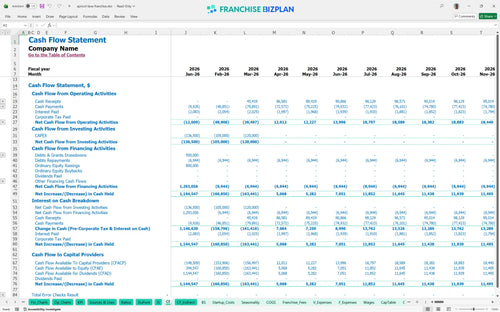
The lowest cash point occurs in March 2026 at $820,000, requiring a solid franchise unit cash flow statement to monitor liquidity. You must maintain a buffer to handle the timing gap between paying for inventory and realizing e-commerce apparel sales. A financial model for opening a boutique clothing store must account for this dip to avoid mid-launch funding crises.
Developing a financial forecast for a retail franchise requires looking at Low, Medium, and High cases. While the Medium case shows $940,000 in year one, a High case driven by superior local marketing execution could significantly shorten the 3-year payback period. The model allows you to stress-test how a 10% drop in revenue impacts your ability to cover the $18,000 monthly rent.
Finance: update unit break-even and payback model by Friday.
This franchise financial model template provides a dynamic Excel environment where you can adjust every variable from rent to local labor rates. It uses pre-filled formulas to link your clothing store startup cost calculator inputs directly to the bottom line, allowing for instant what-if analysis. Every cell is open, so you can tweak the 14.5% inventory cost or the $18,000 rent to see how it shifts your margin.

Long-term planning is vital when scaling a boutique franchise financial projections model. This tool maps out five years of revenue, starting at $940,000 in year one and scaling to over $2.1 million by year five, ensuring you see the full trajectory of your retail unit operational expenses. It provides a clear view of how store-level EBITDA (earnings before interest, taxes, depreciation, and amortization) grows as you build local density.

Managing the 5.5% royalty and 1% marketing fee is built directly into the cash flow to ensure you never overlook brand obligations. At $940,000 in annual sales, you are looking at $61,100 in total brand fund contributions before you pay for a single stylist or utility bill. This section of the franchise unit profit and loss template ensures your net income reflects the reality of a franchised system.

Knowing how to calculate startup costs for a retail franchise is the difference between opening and staying open. With $120,000 in leasehold improvements and $80,000 for initial inventory, this model identifies exactly when your monthly sales cover both fixed and variable costs. It simplifies the complex math of retail franchise financial feasibility study into a single, actionable break-even target.

We include boutique retail financial forecasting benchmarks to ensure your $18,000 monthly rent and staffing levels align with industry standards. If your labor costs exceed the model's projections, you can defintely see the immediate impact on your store-level margin. Use these benchmarks to sanity-check your retail unit operational expenses against high-performing stores in the network.


Simply purchase and download the financial model template, then access it instantly using Microsoft Excel or Google Sheets. No installation or technical expertise required-just open and start working.

Enter your business-specific numbers, including revenue projections, costs, and investment details. The pre-built formulas will automatically calculate financial insights, saving you time and effort.

Leverage the investor-ready format to confidently showcase your financial projections to banks, franchise representatives, or investors. Impress stakeholders with clear, data-driven insights and professional reports.

Leverage the investor-ready format to confidently present your projections to banks, franchise representatives, or investors.