
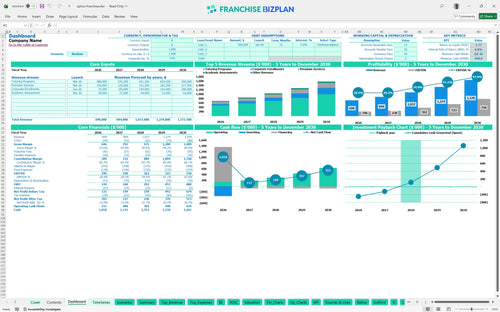
All-in-one Dashboard
Core inputs and core outputs


This financial model template for education franchise units provides a professional-grade Excel workbook to forecast every dollar from launch through maturity.
Core inputs and core outputs
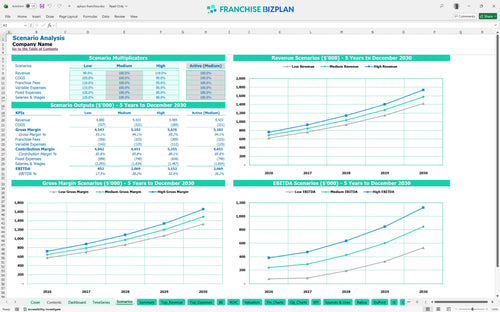
Three scenario analysis
Presentation ready
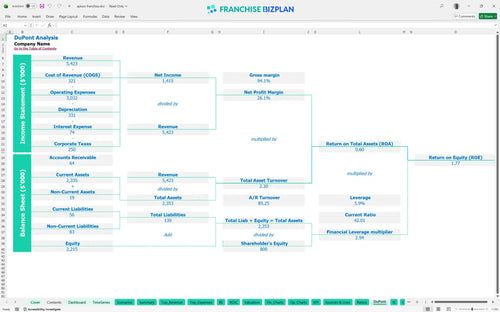
DuPont analysis
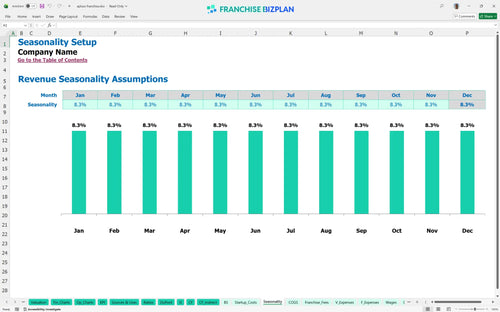
Researched revenue assumptions
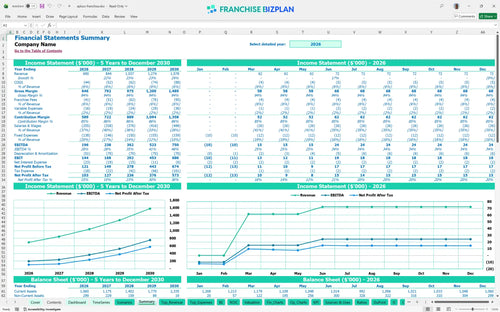
Lender-friendly financial outputs
Revenue stream detailed view
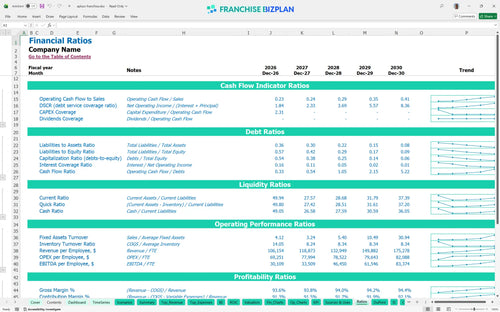
Performance metrics benchmark
We built these tutoring franchise financial projections using our own research into high-end supplemental education models. Key assumptions like the $9,000 monthly rent and the 6% royalty fee are pre-populated based on data for a franchise unit and remain fully editable. With a year-one revenue target of $690,000, this model provides a credible starting point for your Austin-based center.
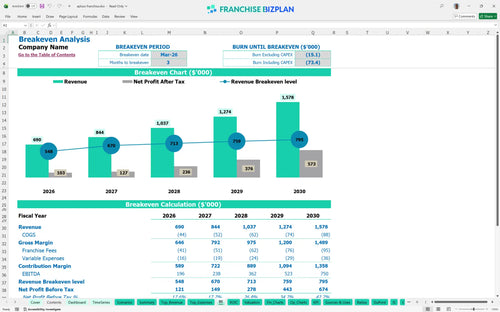
This unit reaches profitability by March 2026, just three months after opening its doors. After accounting for all expenses, including the $11,800 in monthly fixed costs, the model shows EBITDA growing to $750,000 by year five. How to analyze franchise unit profitability starts with understanding this ramp-up speed.
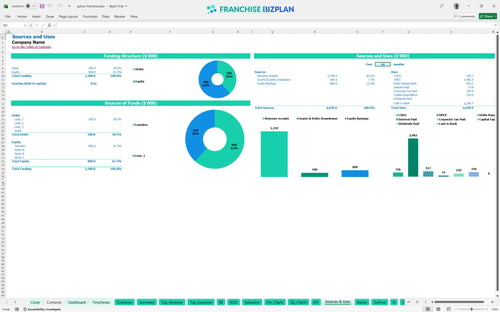
The franchise investment breakdown shows you need approximately $350,000 to launch, with the largest portion allocated to $200,000 in leasehold improvements. This total also covers the $15,000 franchise fee and $45,000 for furniture and fixtures to create a high-end lounge environment. Here is the quick math: your build-out is your biggest hurdle.
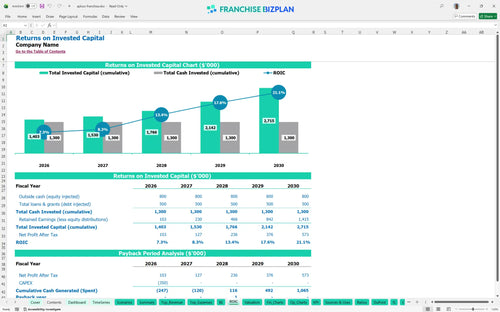
A franchisee can expect a 6.01% Internal Rate of Return (IRR) and a 3-year payback period on their initial capital. The franchise ROI analysis also highlights a Return on Equity (ROE) of 1.77, making it a stable addition for a multi-unit portfolio. What this estimate hides is the potential for higher returns if you scale corporate enrollments faster.
To reach the break-even point by month three, you need to generate enough monthly revenue to cover the $9,000 rent and your $15,000+ base payroll. Your ability to hit this target depends heavily on student volume and maintaining a high average ticket for premium services. Speed to enrollment is your best lever here.
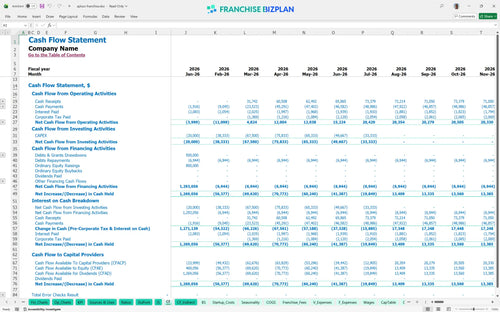
Your lowest cash point is projected at $951,000 in July 2026, which assumes you have funded the business with enough initial capital to survive the ramp-up. You need a solid runway to handle the gap between your January build-out and the March launch. If opening takes 90+ days longer than planned, working capital pressure rises fast.
The model compares Low, Medium, and High scenarios, showing how projecting recurring revenue for education franchises changes based on enrollment speed. A high-case scenario, driven by $200,000 in corporate enrollments by year five, significantly accelerates your total cash flow. Still, even the base case shows a healthy $196,000 EBITDA in the first year.
This franchise unit financial model template is fully customizable in Excel, allowing you to adjust every variable from local rent to tutor pay scales. It is defintely easier to plan when you can swap out assumptions and see the impact on your bottom line instantly. Every cell is open for your input.

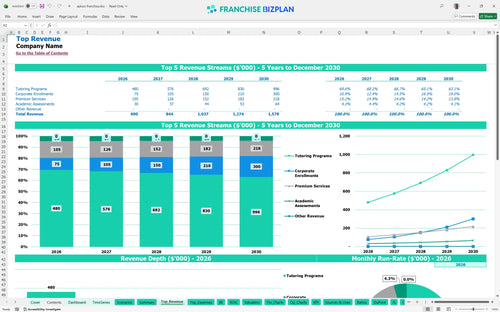
We provide a detailed franchise unit financial performance template that maps out your first 60 months of operation. You can track how revenue scales from $690,000 in your first year to over $1.5 million as your tutoring center matures. Growth isn't just about more students; it's about better margins.

This model simplifies the royalty fee calculation by applying a consistent 6% rate against your projected tutoring revenue. It also accounts for the initial $15,000 franchise fee so you can see the true unit economics after all brand obligations are met. Knowing your net take-home after fees is vital for any operator.

Our franchise startup cost calculator helps you visualize the $350,000 total initial investment, including the heavy $200,000 lift for leasehold improvements. By identifying your fixed and variable costs, the model determines exactly when your monthly sales will cover your overhead. Breakeven is your first real victory.

The model includes built-in benchmarks for estimating operating expenses for a tutoring center, such as keeping educational materials around 5% of sales. This allows you to compare your education franchise business plan against typical industry ranges for labor and occupancy. If your rent exceeds 15% of revenue, the model helps you see the margin squeeze early.


Simply purchase and download the financial model template, then access it instantly using Microsoft Excel or Google Sheets. No installation or technical expertise required-just open and start working.

Enter your business-specific numbers, including revenue projections, costs, and investment details. The pre-built formulas will automatically calculate financial insights, saving you time and effort.

Leverage the investor-ready format to confidently showcase your financial projections to banks, franchise representatives, or investors. Impress stakeholders with clear, data-driven insights and professional reports.

Leverage the investor-ready format to confidently present your projections to banks, franchise representatives, or investors.