
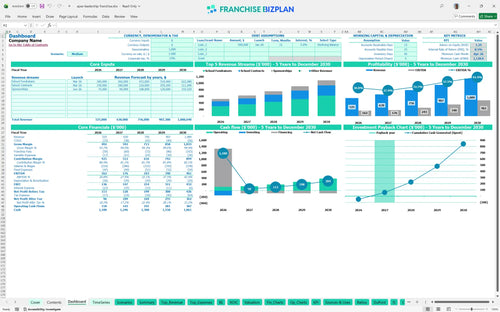
All-in-one Dashboard
Core inputs and core outputs


This Excel spreadsheet for franchise unit profit and loss provides a complete toolkit for estimating recurring revenue and managing a youth development franchise.
Core inputs and core outputs
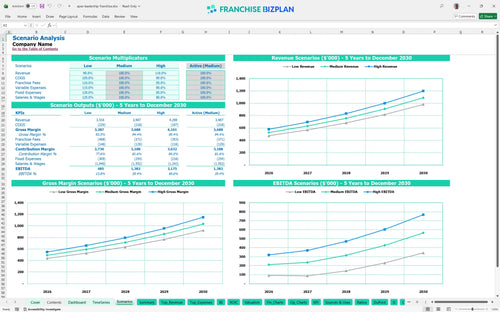
Three scenario analysis
Presentation ready
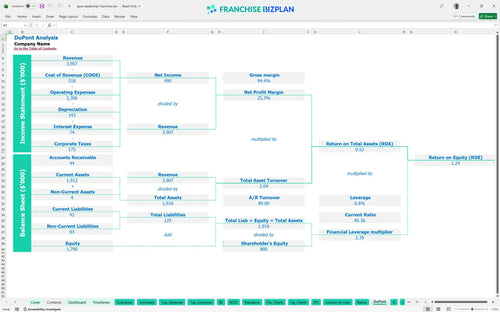
DuPont analysis
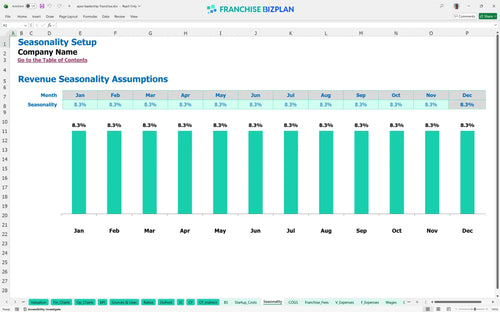
Researched revenue assumptions
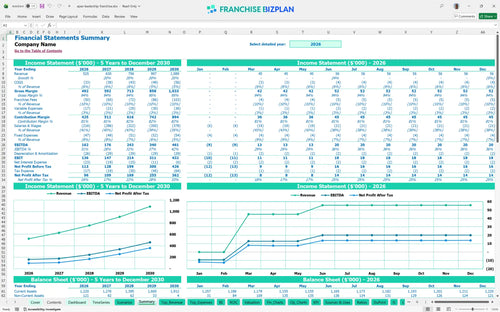
Lender-friendly financial outputs
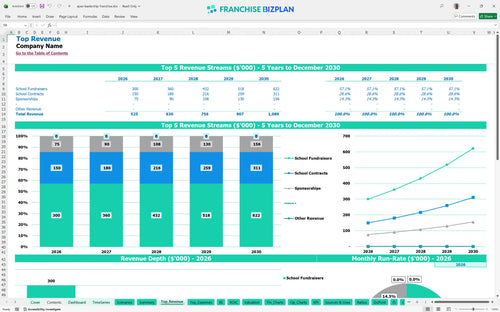
Revenue stream detailed view
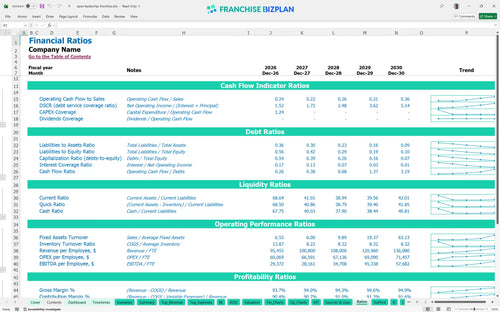
Performance metrics benchmark
We built this franchise unit financial model using deep research into school-based fundraising and youth development. The model comes pre-populated with a $49,500 franchise fee, an 8% royalty structure, and Year 1 revenue targets of $525,000, all of which you can edit to fit your specific market. This data-driven approach helps you move from a business plan to actual store-level execution without the guesswork.
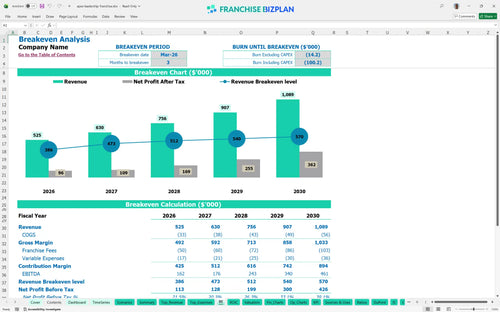
The unit hits profitability in March 2026, just three months after launching. EBITDA (earnings before interest, taxes, depreciation, and amortization) grows from $162,000 in Year 1 to $461,000 by Year 5 as school contracts and sponsorships scale. Profit isn't an accident; it's a scheduled event.
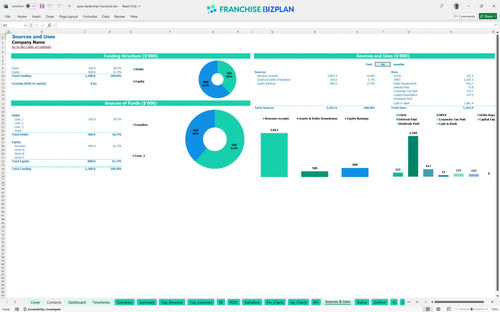
You need approximately $147,000 in upfront capital to launch this youth education franchise in the US. This covers your territory rights, equipment, and the first few months of operating expenses until the revenue from school fundraisers kicks in. Capital is the fuel for your franchise engine.
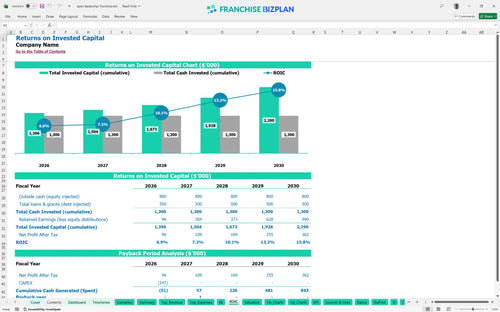
Investors can expect an IRR (internal rate of return) of 8.46% and a full payback on the initial investment within 2 years. With a Year 1 EBITDA margin of nearly 30%, the model shows strong cash-on-cash potential for active operators. ROI tells you if the risk was worth the reward.
The monthly break-even point occurs in month 3, assuming you hit your initial school fundraiser targets. Reaching this point defintely depends on your ability to secure contracts before the school year starts to ensure immediate volume. The break-even point is your first real victory.
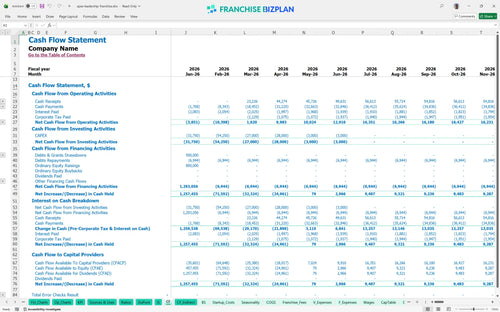
The lowest cash point is $1,129,000 in April 2026, which includes your initial investment and early working capital needs. You should maintain a 3-month buffer to handle the timing gaps between school events and donor payouts. Cash is king, especially during the ramp-up.
The High scenario assumes faster sponsorship growth, potentially pushing Year 1 EBITDA over $200,000. Conversely, a Low scenario with 20% fewer school contracts would extend the payback period by an additional 12 months. Plan for the best, but model for the worst.
This franchise unit financial model template is a flexible Excel tool designed for precision. You can adjust pre-filled formulas and editable assumptions to match your specific territory, whether you are looking at a single location or a small franchise chain. Control your numbers or they will control you.

Plan your long-term growth with a revenue forecasting model that tracks performance from Year 1 at $525,000 to Year 5 at $1,089,000. These projections include detailed cash flow and profit views to help you manage multi-unit expansion or single-unit stability. Growth is a choice, but cash flow is a reality.

This tool simplifies royalty fee structure analysis by automating the 8% royalty and 1.5% marketing fund calculations. It ensures you account for the $49,500 initial fee and ongoing obligations before you calculate your take-home pay. Royalties are the price of a proven system.

Use the franchise startup cost calculator to map out your initial $147,000 investment, covering everything from equipment to pre-opening labor. The model identifies the exact sales volume needed to cover your fixed costs and move into the black. Speed to break-even is the best risk mitigator.

Our small business financial projection template includes built-in benchmarks for labor and occupancy to help you sanity-check your local operating expenses. Compare your expected margins against industry standards to ensure your unit performance metrics stay competitive. Don't guess when you can benchmark.


Simply purchase and download the financial model template, then access it instantly using Microsoft Excel or Google Sheets. No installation or technical expertise required-just open and start working.

Enter your business-specific numbers, including revenue projections, costs, and investment details. The pre-built formulas will automatically calculate financial insights, saving you time and effort.

Leverage the investor-ready format to confidently showcase your financial projections to banks, franchise representatives, or investors. Impress stakeholders with clear, data-driven insights and professional reports.

Leverage the investor-ready format to confidently present your projections to banks, franchise representatives, or investors.