
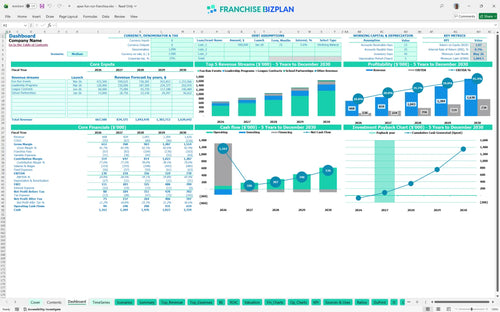
All-in-one Dashboard
Core inputs and core outputs


This franchise unit economic model provides a complete toolkit of automated financial statements, CAPEX schedules, and scenario toggles designed for professional-grade business planning.
Core inputs and core outputs
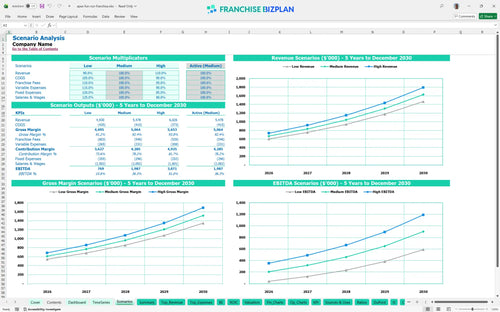
Three scenario analysis
Presentation ready
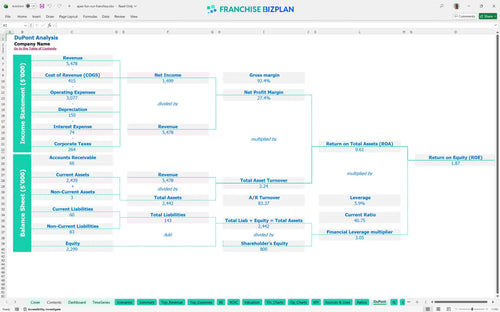
DuPont analysis
Researched revenue assumptions
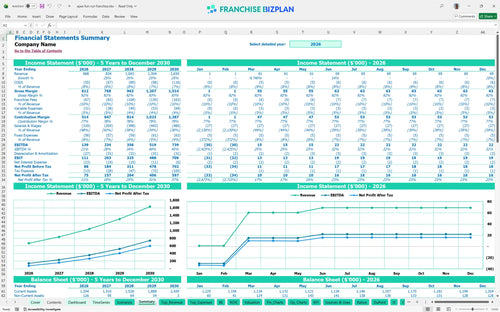
Lender-friendly financial outputs
Revenue stream detailed view
Performance metrics benchmark
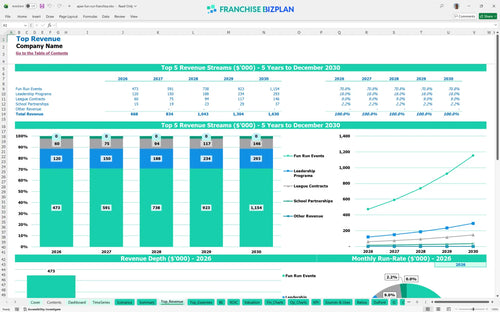
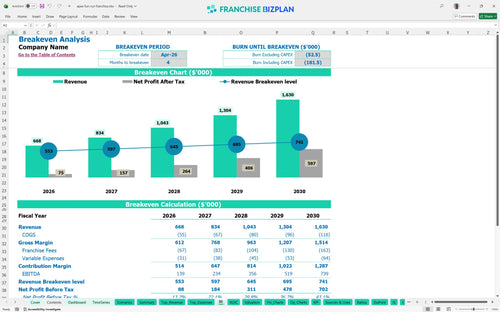
We built this financial model template for school fundraising franchise units using detailed research into the specific unit economics of the sector. The model comes pre-loaded with a $668,000 Year 1 revenue projection and a 4-month break-even analysis, all of which are fully editable to fit your local market. It provides a clear school fundraising franchise business plan example that balances high-energy service delivery with disciplined overhead management.
This franchise profitability analysis indicates the unit reaches a positive bottom line by April 2026, just four months after launching. By Year 2, EBITDA is projected to climb to $234,000 as you scale your event count and leverage your fixed costs. You need to keep a close eye on your 8% royalty fee structure to ensure margins stay healthy during the ramp-up.
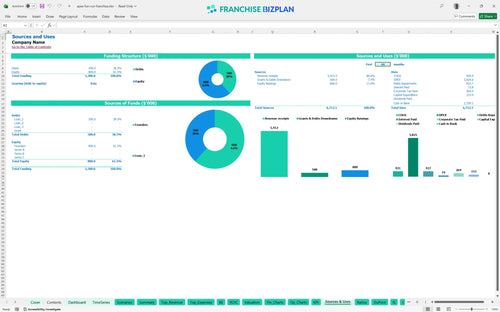
To launch this service franchise financial forecasting model, you will need approximately $153,000 in initial capital. This investment covers the $49,500 franchise fee and critical assets like the $35,000 vehicle acquisition and $25,000 in event equipment. Here's the quick math: your upfront costs are heavily weighted toward mobility and high-impact sound systems.
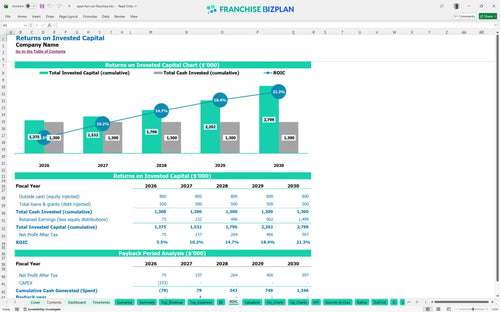
The franchise investment return calculator shows a 2-year payback period and an internal rate of return of 8.34%. With a Year 5 EBITDA target of $739,000, the long-term return on equity stands at 1.87. Still, your return on investment calculation will defintely depend on maintaining a high average ticket across your school partnerships.
Your break-even analysis shows you need to cover about $4,650 in monthly fixed costs, including the $1,800 rent and $900 vehicle lease. Reaching the break-even point in four months requires steady event volume from the start. The biggest lever here is the productivity of your Sales Representative, who starts at a $48,000 base salary.
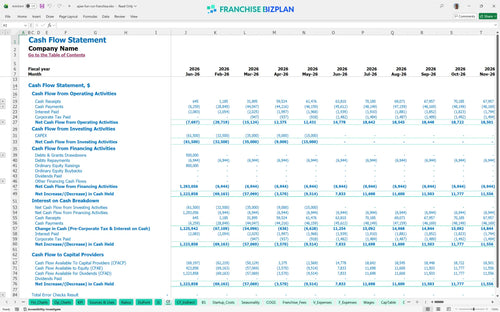
The Excel template for franchise unit cash flow analysis identifies May 2026 as the lowest cash point, with a balance of $1,085,000. This suggests you need significant liquidity to manage the operating expenses for service-based franchise units during the initial growth phase. Plus, having a buffer helps when school payment cycles lag behind your event execution dates.
This franchise unit financial projection spreadsheet allows you to test how Low, Medium, and High scenarios impact your Year 1 EBITDA of $139,000. If revenue grows to the $1.63M High case by Year 5, your profitability timing accelerates significantly. It's the best way to see how sensitive your cash flow is to changes in event pricing or royalty payments.
Finance: update unit break-even and payback model by Friday.
This franchise financial model template is built in Excel with fully editable assumptions and pre-linked formulas, allowing you to swap out local rent or labor rates instantly. You can adjust every revenue driver and expense line to see how different operating scenarios impact your bottom line before you sign a lease.

Plan for long-term scale with a franchise unit financial projection spreadsheet that maps out your growth from opening day through year five. It tracks revenue, EBITDA, and cash flow, giving you a clear view of how your profit margins should expand as you build local density and brand awareness.

This tool makes it easy to learn how to estimate royalty payments for franchise operations by automating the math for an 8% royalty and 2% marketing fund. It ensures you account for every dollar owed to the franchisor, including the initial franchise fee and obligations found in the franchise disclosure document, so your net income projections remain realistic.

Use the franchise startup cost calculator to identify exactly how much capital you need for equipment, vehicles, and office setup. It integrates a detailed break-even analysis so you can determine the specific sales volume required to cover your monthly fixed costs and start generating a profit. Knowing how to calculate franchise startup costs in Excel is the first step to avoiding early liquidity traps.

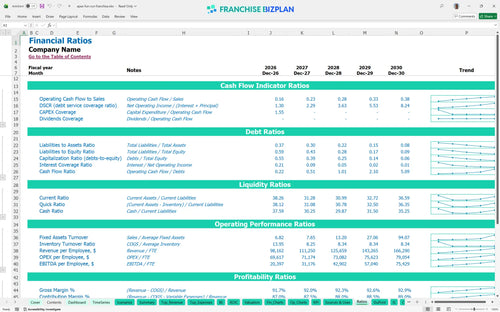
The model includes unit economics and industry benchmarks to help you sanity-check your labor costs and gross margins against typical service-based franchises. These steps to evaluate franchise profitability ensure your assumptions aren't too aggressive, keeping your business plan grounded in real-world performance data and regional standards.


Simply purchase and download the financial model template, then access it instantly using Microsoft Excel or Google Sheets. No installation or technical expertise required-just open and start working.

Enter your business-specific numbers, including revenue projections, costs, and investment details. The pre-built formulas will automatically calculate financial insights, saving you time and effort.

Leverage the investor-ready format to confidently showcase your financial projections to banks, franchise representatives, or investors. Impress stakeholders with clear, data-driven insights and professional reports.

Leverage the investor-ready format to confidently present your projections to banks, franchise representatives, or investors.