


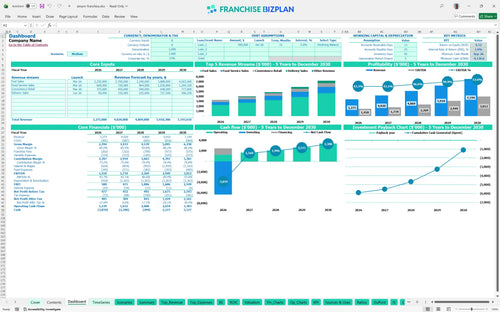
All-in-one Dashboard
Core inputs and core outputs



This franchise financial projection template includes revenue forecasting tools for multi-stream franchise businesses, detailed CAPEX scheduling, and 5-year EBITDA tracking to ensure your unit remains competitive.
Core inputs and core outputs
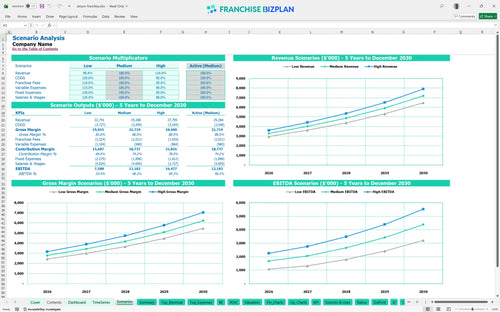
Three scenario analysis
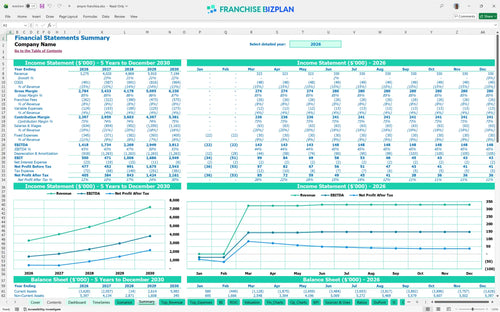
Presentation ready
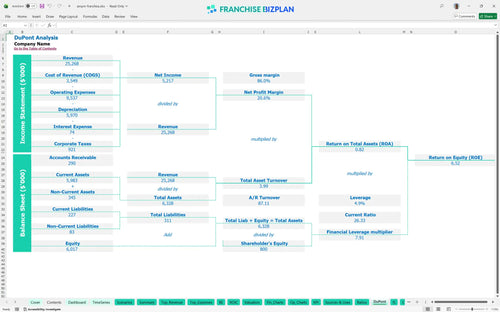
DuPont analysis
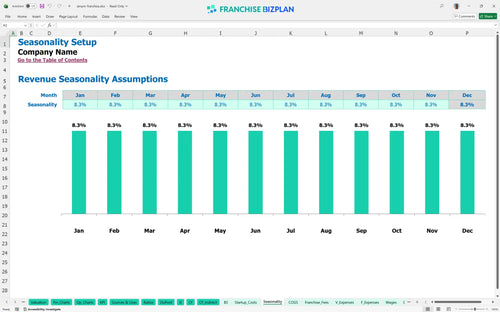
Researched revenue assumptions
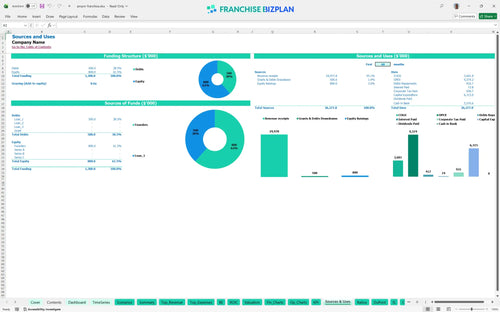
Lender-friendly financial outputs
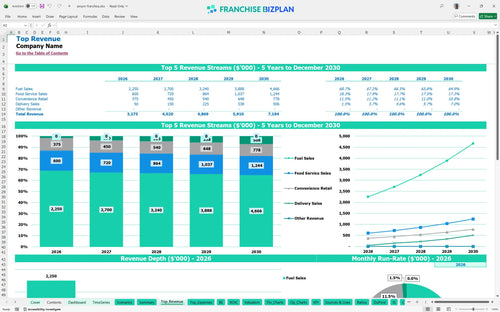
Revenue stream detailed view
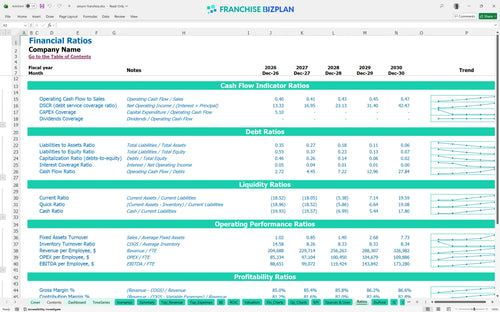
Performance metrics benchmark
We built this franchise unit financial model using our own research to provide a realistic operational profitability analysis. Key assumptions like revenue streams, $18,000 monthly rent, and the 6% royalty fee are pre-populated with researched data specific to ampm Franchise franchise unit and are fully editable. With Year 1 EBITDA projected at $1.41 million, this model shows you exactly how the unit economics play out in a high-traffic environment.
This franchise unit reaches profitability quickly, showing a positive EBITDA of $1.41 million in its first year. By year five, net profit scales significantly as revenue hits $7.19 million and food cost of sales drops to 3.7%. Honestly, the speed of your ramp-up is the real deal-breaker for your bottom line.
Launching this unit requires a massive initial investment, primarily driven by $4 million for fuel tanks and dispensers and $1.2 million for leasehold improvements. This is the best financial model for 24-hour convenience store operations because it accounts for the $40,000 franchise fee and $200,000 in initial inventory. This comprehensive startup budget template for retail franchises ensures you don't under-capitalize during the build-out.
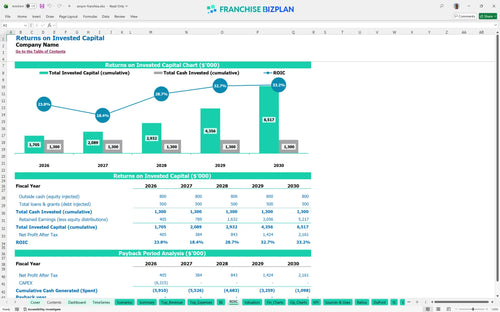
The franchise ROI calculation shows an Internal Rate of Return of 1.89% and a Return on Equity of 6.52%. Because of the heavy $4 million upfront CAPEX for fuel systems, the payback period extends beyond the first five years of operation. This is a long-term infrastructure play, not a quick cash grab. Patience is a requirement for this level of investment.
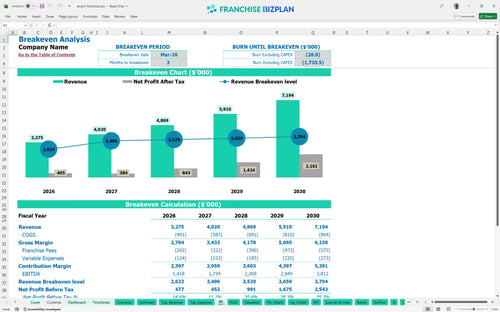
Calculating break-even point for gas station franchises reveals that this unit hits its stride in March 2026, just three months after launch. The primary driver for this quick break-even is the high-volume fuel sales, though the 8% combined royalty and marketing burden remains a constant pressure on monthly fuel station operating expenses. Speed to break-even is your best defense against market volatility.
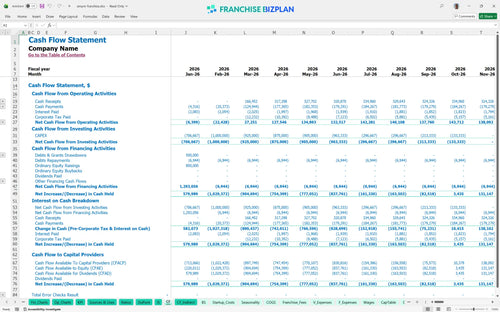
The lowest cash point occurs in September 2026 at negative $4.13 million, highlighting the need for robust retail business cash flow forecasting and secure financing. You will need a significant cash buffer to handle the timing gaps between the $1.2 million build-out and mature-unit performance. Franchise financial planning for high-traffic locations means being ready for the 'valley of death' during construction. You defintely need your credit lines ready before day one.
Estimating profitability for fuel and food service franchises requires looking at High vs Low cases; a 10% revenue drop in the Low case can delay your break-even by several months. In the High scenario, improving your franchise unit performance metrics by pushing the $829k food service stream can significantly boost your Year 5 EBITDA. High-traffic locations have high ceilings but very little room for error. Execution at the store level is what separates the winners from the losers.
This convenience store franchise financial model is built in Excel, allowing you to modify every variable to suit your specific territory. Whether you are adjusting fuel margins or local labor rates, the pre-filled formulas handle the heavy lifting so you don't have to be a spreadsheet guru. It is the best Excel template for convenience store financial forecasting on the market today. Every 1-point margin leak matters fast in a single-unit model.

Mapping out five years of performance helps you see beyond the initial grand opening. This gas station franchise business plan template projects revenue growing from $3.27 million in year one to over $7.1 million by year five, providing a clear roadmap for scaling. Long-term planning is the only way to survive the low-margin reality of retail. Numbers don't lie, but they do require a long-term lens.

Royalties and brand funds are the fixed obligations that can eat your lunch if you don't track them precisely. This franchise investment analysis spreadsheet for small business calculates the 6% royalty and 2% marketing fee automatically against your projected sales, so you know exactly what is left for your pocket. If labor runs high, these fees make your store-level margin even tighter. Managing the franchisor's cut is just as important as managing your inventory.

Getting the doors open requires significant capital, and this franchise unit startup cost spreadsheet identifies your total investment needs. From the $40,000 initial fee to the multi-million dollar fuel infrastructure, you will learn how to calculate startup costs for a gas station franchise without missing hidden expenses. Knowing your 'stop-bleeding' point is the first step to sleeping better at night. Break-even depends more on repeat demand than headline sales.

Don't guess on your numbers; use our built-in benchmarks to see if your 10.5% fuel and merchandise COGS is realistic for your market. Comparing your fuel and retail franchise investment calculator outputs against industry standards ensures your plan is grounded in reality rather than wishful thinking. If your rent exceeds 9% of sales, you need to find margin elsewhere. Benchmarks are the guardrails that keep your business on the road.


Simply purchase and download the financial model template, then access it instantly using Microsoft Excel or Google Sheets. No installation or technical expertise required-just open and start working.

Enter your business-specific numbers, including revenue projections, costs, and investment details. The pre-built formulas will automatically calculate financial insights, saving you time and effort.

Leverage the investor-ready format to confidently showcase your financial projections to banks, franchise representatives, or investors. Impress stakeholders with clear, data-driven insights and professional reports.

Leverage the investor-ready format to confidently present your projections to banks, franchise representatives, or investors.