
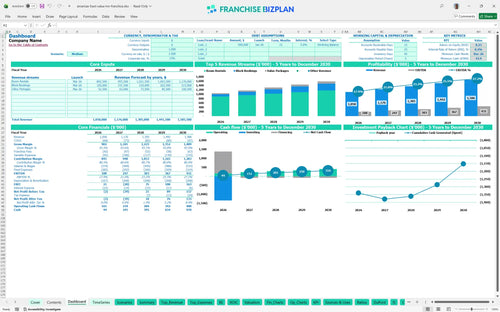
All-in-one Dashboard
Core inputs and core outputs


This hotel business plan template provides a detailed Excel-based framework to project revenue, manage expenses, and calculate total ROI for a budget hospitality unit.
Core inputs and core outputs
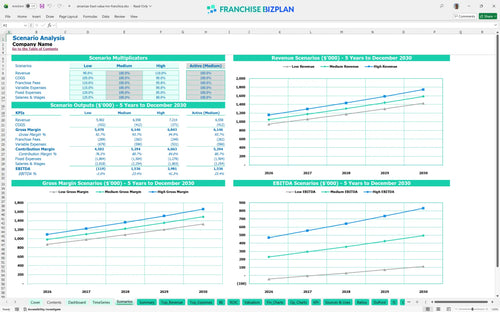
Three scenario analysis
Presentation ready
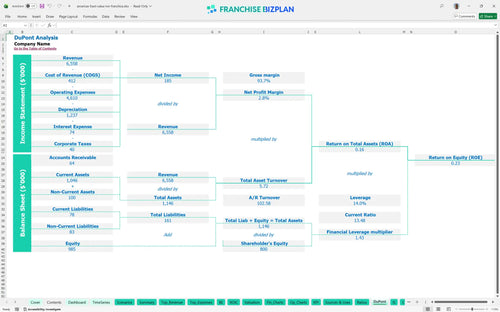
DuPont analysis
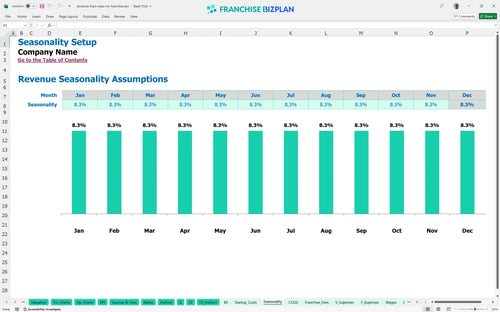
Researched revenue assumptions
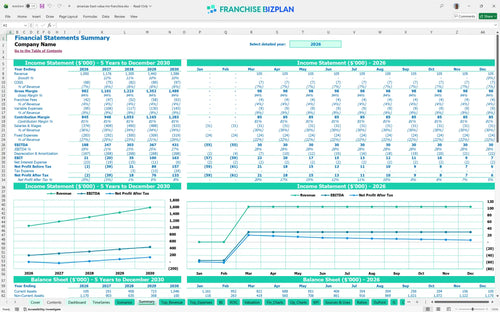
Lender-friendly financial outputs
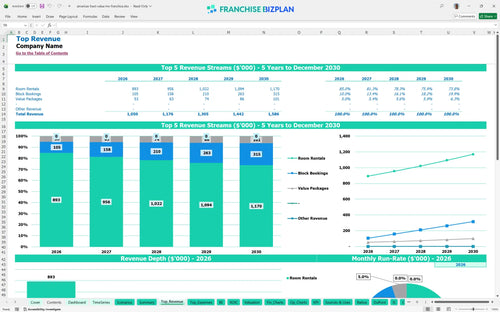
Revenue stream detailed view
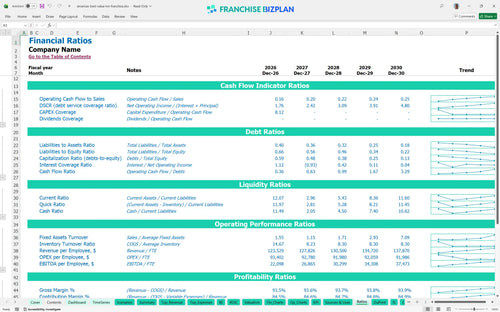
Performance metrics benchmark
We built this hotel franchise financial model based on deep research into economy lodging performance and brand standards. The assumptions for room rentals, block bookings, and staffing-like the $75,000 GM salary and $15,000 monthly lease-are pre-populated and ready for your specific location. With a projected year-one EBITDA of $188,000, this tool helps you map out the path to a 21% internal rate of return.
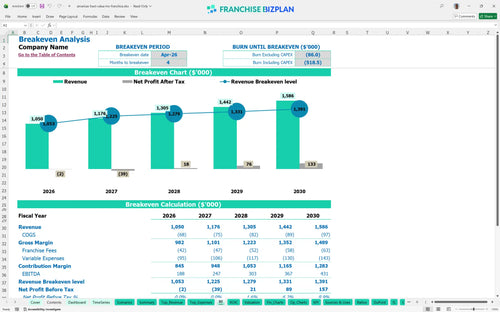
This franchise unit hits its stride quickly, reaching a monthly break-even point by April 2026, just four months after launching. By year two, EBITDA grows to $247,000 as room rentals and value packages scale, covering the fixed costs and the 4% royalty burden.
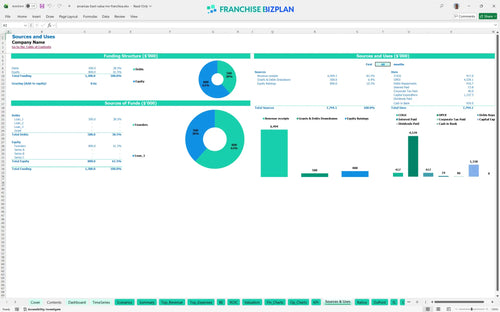
You will need a significant capital injection to get this unit off the ground, with major outlays for property renovation and technology. The total initial investment covers the $17,500 franchise fee plus over $1.3M in CAPEX and setup costs to meet brand standards.
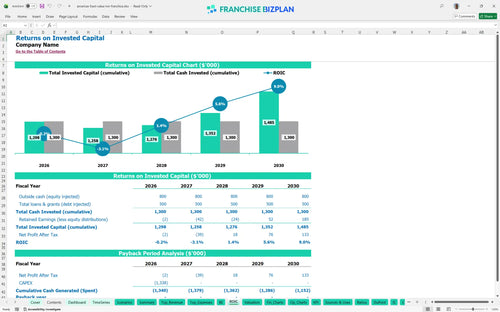
Investors can expect an internal rate of return (IRR) of 21% and a return on equity (ROE) of 23% over the five-year hold. While the cash-on-cash returns are strong, the full payback of the initial investment occurs after year five due to the heavy upfront renovation costs.
The unit needs to generate enough volume to cover $23,600 in monthly fixed costs, including rent, utilities, and insurance. Occupancy is the biggest driver here; hitting the break-even point in month four depends defintely on securing block bookings early and managing the 30% combined labor and variable cost load.
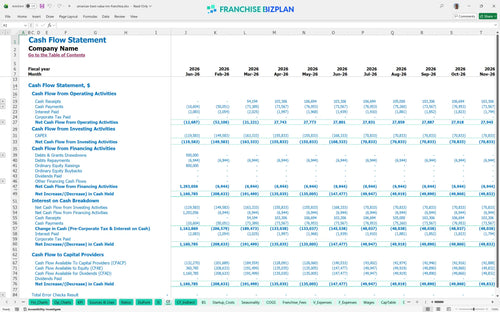
The lowest cash point occurs in December 2026, with a minimum cash balance of $44,000. You need to maintain a tight grip on working capital during the first year of ramp-up to ensure you don't dip below this buffer while paying your $15,000 monthly lease.
A 10% drop in room rental revenue significantly delays the payback period and increases the peak cash need during the first year. Conversely, hitting high-occupancy targets through medical center referrals can push year-one EBITDA well above the $188,000 baseline and improve the 23% ROE.
Finance: update unit break-even and payback model by Friday.
This hotel franchise financial model is fully customizable in Excel, allowing you to swap out every assumption from room rates to local utility costs. You can adjust the pre-filled formulas to match your specific site near medical centers or high-traffic corridors, ensuring the math reflects your actual market and operating scenario.

Plan your long-term hospitality strategy with detailed projections covering five full years of operations. The model tracks how revenue climbs from $1,050,000 in year one to over $1,586,000 by year five, giving you a clear view of how scaling occupancy and room rates impacts your bottom line and long-term profitability.

The tool simplifies complex fee structures by calculating the 4% royalty fee against your gross room rentals and block bookings. It accounts for the initial $17,500 franchise fee and tracks ongoing brand obligations so you know exactly how much cash stays in the business after the franchisor gets paid.

Opening a budget hotel requires significant upfront capital, including $850,000 for leasehold improvements and $250,000 for guest room furnishings. This franchise investment calculator helps you determine the exact sales volume needed to cover your $15,000 monthly rent and other fixed costs to reach your margin targets.

We've integrated industry-standard metrics for economy lodging to help you sanity-check your operational expenses. Whether you are looking at the 6.5% OTA commissions or the 4.5% linen and laundry costs, these benchmarks ensure your franchise unit performance metrics align with real-world hospitality standards.


Simply purchase and download the financial model template, then access it instantly using Microsoft Excel or Google Sheets. No installation or technical expertise required-just open and start working.

Enter your business-specific numbers, including revenue projections, costs, and investment details. The pre-built formulas will automatically calculate financial insights, saving you time and effort.

Leverage the investor-ready format to confidently showcase your financial projections to banks, franchise representatives, or investors. Impress stakeholders with clear, data-driven insights and professional reports.

Leverage the investor-ready format to confidently present your projections to banks, franchise representatives, or investors.