
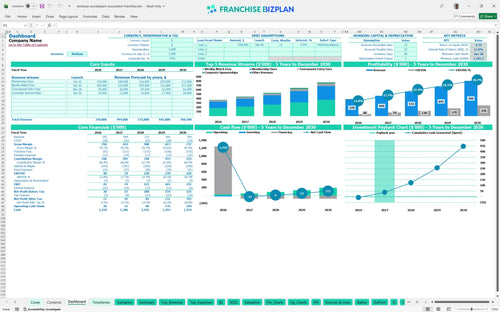
All-in-one Dashboard
Core inputs and core outputs


This tool provides a complete Excel template for franchise unit cash flow projection, including pre-loaded costs for equipment, staffing, and royalties.
Core inputs and core outputs
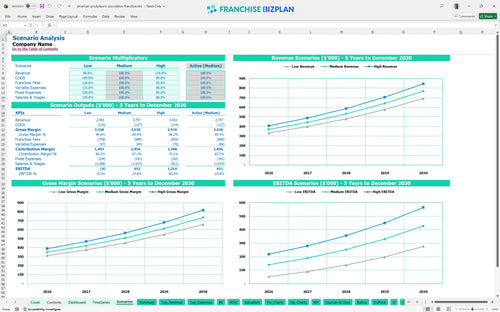
Three scenario analysis
Presentation ready
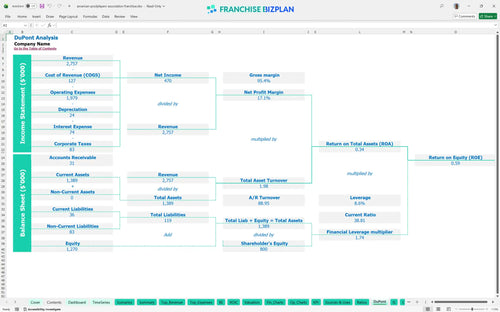
DuPont analysis
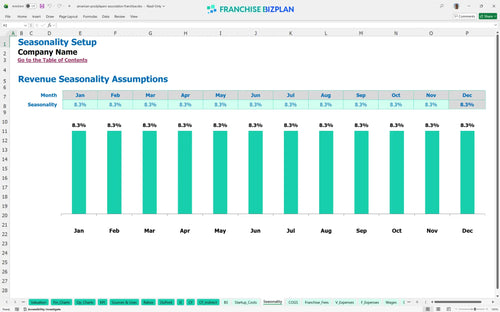
Researched revenue assumptions
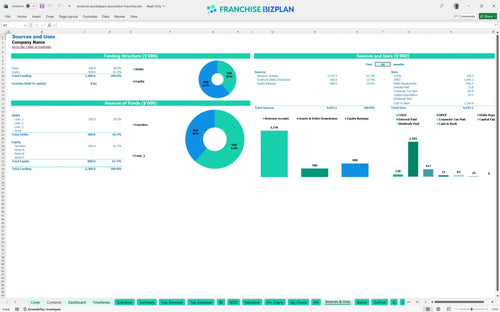
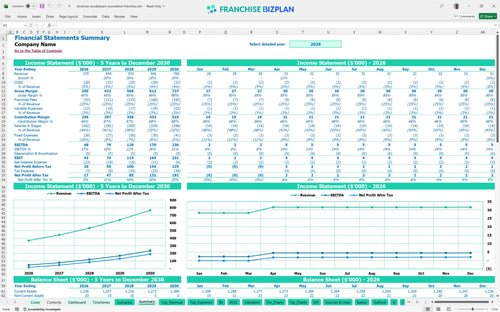
Lender-friendly financial outputs
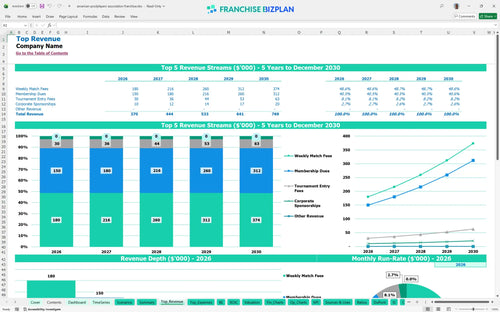
Revenue stream detailed view
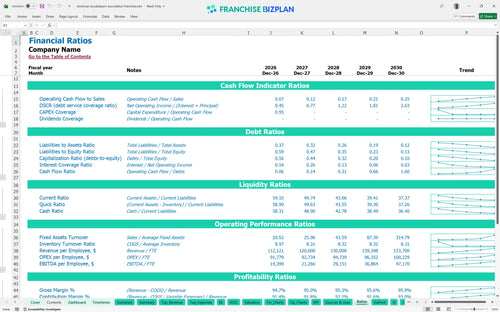
Performance metrics benchmark
We developed this franchise financial model template for the American Poolplayers Association Franchise based on deep research into league operations and territory management. The model comes pre-populated with data like $120,000 in first-year weekly match fees and a 20% royalty structure, but you can defintely edit every cell to fit your local market. It's designed to help you analyze revenue potential for local sports leagues while managing a lean staff of operators and ambassadors.
Based on our analysis, the unit reaches profitability in its first month, specifically January 2026. With Year 1 EBITDA projected at $48,000 and scaling to $236,000 by Year 5, the model shows a strong upward trajectory as membership dues and tournament fees grow. Profits don't happen by accident; they happen by schedule.
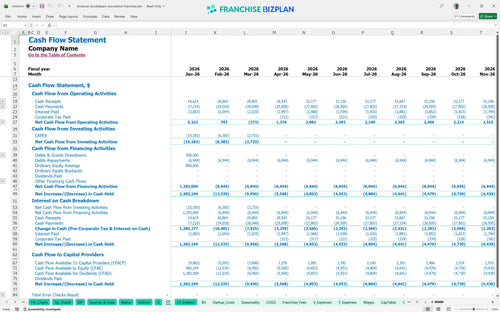
To launch this unit, you need to account for a $10,000 franchise fee plus roughly $14,300 in additional startup costs like IT, furniture, and training. The model tracks these capital expenditures (CAPEX) to ensure you have enough cash to cover the initial ramp-up and maintain a minimum cash balance of $1,186. Capital is fuel; make sure you aren't leaking it before you start the engine.
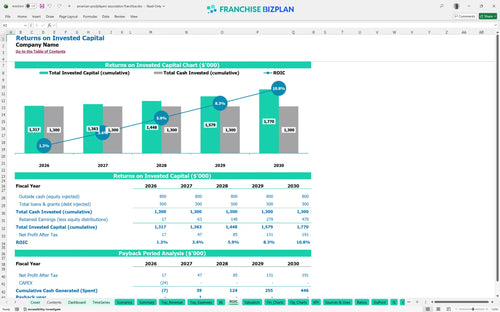
The model projects an Internal Rate of Return (IRR) of 13.78% and a Return on Equity (ROE) of 0.59. With a payback period of just 2 years, this service-based franchise shows efficient capital recovery compared to high-overhead retail models. A two-year payback is a sprint in the franchise world.
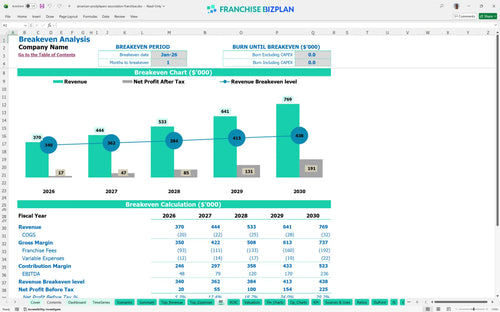
The unit hits its break-even point in January 2026, the very first month of operation. The primary driver for reaching this target is the volume of weekly match fees, which must cover the high 20% royalty burden and fixed costs like the $1,200 monthly co-working rent. Break-even is your first real victory.
The lowest cash point occurs in January 2028 at $1,186, suggesting that while the unit breaks even early, growth-related expenses like hiring a marketing coordinator can tighten liquidity. We recommend a small cash buffer to handle the timing gaps between member dues collection and royalty payments. Cash is oxygen, and ramp-up is a high-altitude climb.
Our franchise profitability analysis includes sensitivity testing for low, medium, and high performance. A 10% drop in membership retention can delay your payback period, while hitting the high case through aggressive corporate sponsorships can push Year 5 EBITDA well beyond the $236,000 baseline. The high case is a goal, but the low case is the reality you must survive.
Finance: update unit break-even and payback model by Friday
This franchise financial model template is a fully dynamic tool built in Excel. You can adjust pre-filled formulas and assumptions to match your specific territory, whether you are in Austin or another high-growth corridor. It allows you to swap out local rent, adjust league sizes, and refine staffing levels to see how they impact your bottom line. Every formula is open, so you can break it and fix it to match your reality.

Long-term planning is vital for a service-based franchise model where membership builds over time. This tool provides a clear roadmap from year one through year five, showing how revenue scales from $370,000 to $769,000 as your league density increases. You get a full view of your balance sheet and cash flow to ensure you have the runway needed for expansion. Five years is a lifetime in small business, but it's the minimum for a real strategy.

This model handles the heavy lifting of calculating recurring costs like the 20% royalty fee and 5% marketing fund contribution. By automating these calculations against your weekly match fees and membership dues, you see the exact impact on your store-level margin. Understanding these fixed percentages helps you price your league entries correctly to protect your take-home pay. Royalties are a fact of life; don't let them be a surprise.

Use this franchise startup cost calculator to map out every dollar needed before your first league night. From the $10,000 initial fee to IT setup and office furniture, the model totals your initial investment so you aren't surprised by hidden costs. It also identifies the exact sales volume required to cover your fixed monthly expenses like co-working rent and vehicle leases. Knowing your number is the difference between a business and a hobby.

We include benchmarks for labor and occupancy to help you stay within healthy ranges for a recreational franchise. If your payroll for league operators and field ambassadors exceeds typical margins, the model flags it. This helps you maintain a lean operation while scaling your member base in competitive local sports leagues. Benchmarks keep your ego in check and your bank account full.


Simply purchase and download the financial model template, then access it instantly using Microsoft Excel or Google Sheets. No installation or technical expertise required-just open and start working.

Enter your business-specific numbers, including revenue projections, costs, and investment details. The pre-built formulas will automatically calculate financial insights, saving you time and effort.

Leverage the investor-ready format to confidently showcase your financial projections to banks, franchise representatives, or investors. Impress stakeholders with clear, data-driven insights and professional reports.

Leverage the investor-ready format to confidently present your projections to banks, franchise representatives, or investors.