
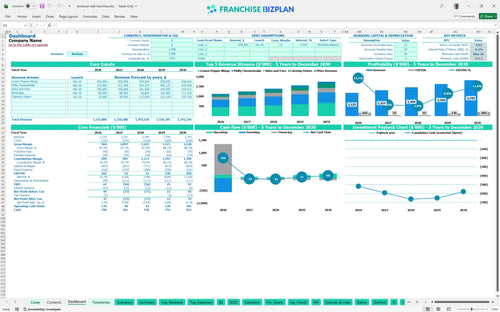
All-in-one Dashboard
Core inputs and core outputs


This quick service restaurant financial model provides a complete toolkit for forecasting P&L, cash flow, and startup requirements for a high-volume deli unit.
Core inputs and core outputs
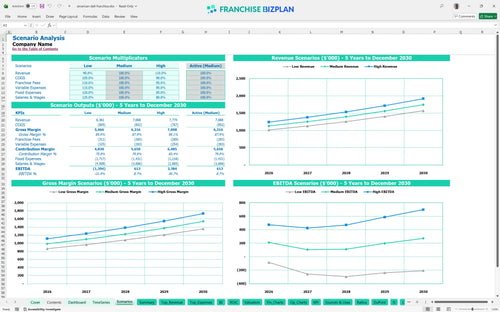
Three scenario analysis
Presentation ready
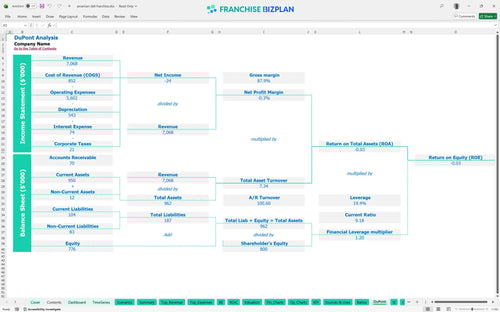
DuPont analysis
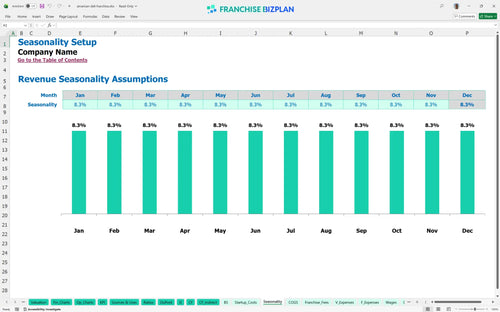
Researched revenue assumptions
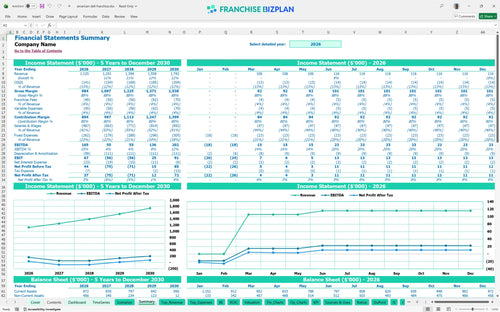
Lender-friendly financial outputs
Revenue stream detailed view
Performance metrics benchmark
We built this franchise unit financial model using real-world research for a high-volume deli concept. Key assumptions like the $555,000 startup cost and the 4% combined royalty and marketing fee are pre-populated and fully editable. Based on the data, you can expect year one revenue of $1,125,000 with a quick 4-month path to operational break-even.
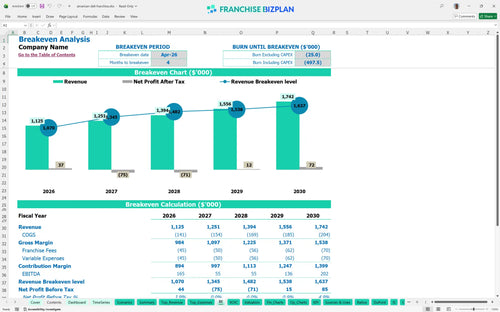
The unit reaches operational break-even by April 2026, just four months after launch. While Year 1 EBITDA is strong at $165,000, the model shows a dip to $55,000 in Year 2 as labor scales, with a recovery to $202,000 by Year 5.
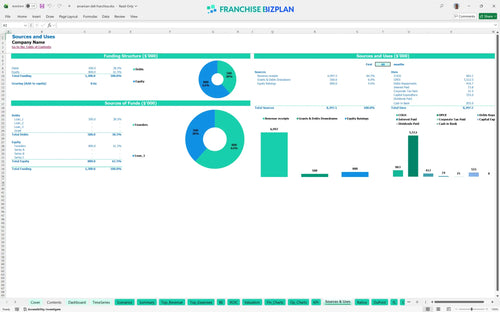
You will need roughly $555,000 in total initial investment for the build-out and equipment. The model also accounts for a minimum cash requirement of $717,000 by May 2026 to cover the ramp-up phase and working capital needs.
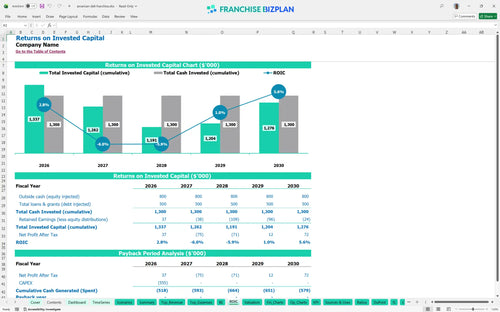
This franchise investment return on investment calculator shows a challenging start with a negative IRR of -0.16 and a payback period extending beyond five years. While store-level EBITDA is positive, the high initial investment and rent costs mean long-term equity growth requires disciplined expense management.
The unit hits its monthly break-even in April 2026. The primary driver is the high fixed cost base, specifically the $15,000 monthly rent and $22,000 in monthly management and supervisor salaries, which require high daily volume from wings and cheesesteaks to cover.
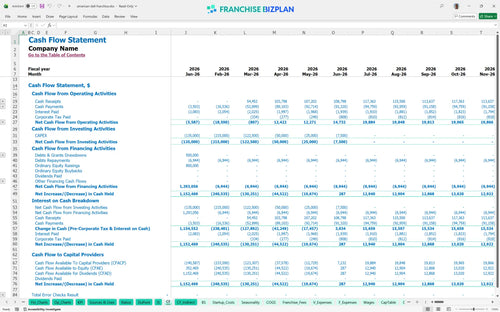
The lowest cash point occurs in May 2026 at $717,000. This suggests you need a significant liquidity buffer beyond the initial build-out costs to survive the first six months of operations while the catering and digital channels ramp up.
In a High scenario, hitting $1.7M in revenue earlier would significantly improve the IRR and shorten the payback period. Conversely, a Low scenario with 10% lower sales would likely result in year-over-year losses given the $15,000 fixed rent and 4% royalty burden.
This franchise financial model template is built in Excel, allowing you to tweak every variable from wing prices to crew member hours. It uses pre-filled formulas and editable assumptions so you can test different locations or labor markets without breaking the spreadsheet logic.

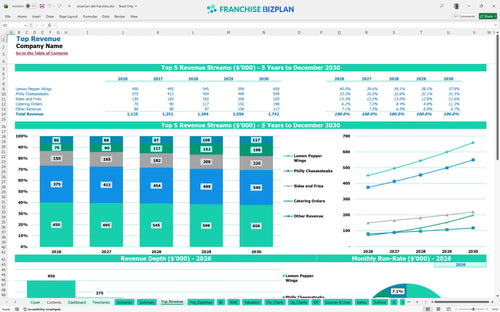
Use this restaurant business plan excel to map out long-term growth across five years of operations. It tracks revenue growth from $1.12M in year one to over $1.7M by year five, helping you see the impact of scaling catering and digital orders over time.

The model handles the specific math of a 3% royalty and 1% marketing fund contribution automatically. By factoring these in alongside the initial $10,000 fee, you get a clear view of how much cash stays in the unit versus going to the franchisor.

Estimating operating costs for a new franchise location starts with the $555,000 initial capital investment. This franchise investment calculator shows you need to hit the break-even point by month four to stay on track with the $15,000 monthly rent obligation.

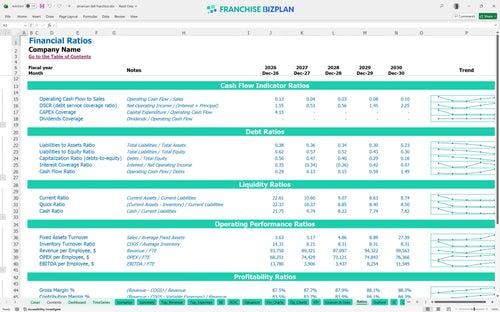
We include benchmarks for quick service restaurant franchise profit margin analysis to ensure your food costs-starting at 11%-and labor stay within healthy ranges. This helps you defintely spot if your manager salaries or utility bills are out of line with typical deli standards.


Simply purchase and download the financial model template, then access it instantly using Microsoft Excel or Google Sheets. No installation or technical expertise required-just open and start working.

Enter your business-specific numbers, including revenue projections, costs, and investment details. The pre-built formulas will automatically calculate financial insights, saving you time and effort.

Leverage the investor-ready format to confidently showcase your financial projections to banks, franchise representatives, or investors. Impress stakeholders with clear, data-driven insights and professional reports.

Leverage the investor-ready format to confidently present your projections to banks, franchise representatives, or investors.