
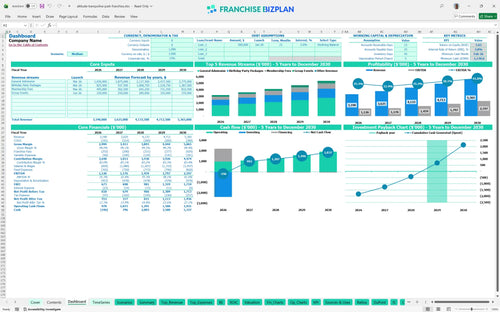
All-in-one Dashboard
Core inputs and core outputs


This franchise unit financial model template provides a complete Excel financial template for indoor amusement center operations, including revenue drivers, CAPEX schedules, and 5-year pro formas.
Core inputs and core outputs
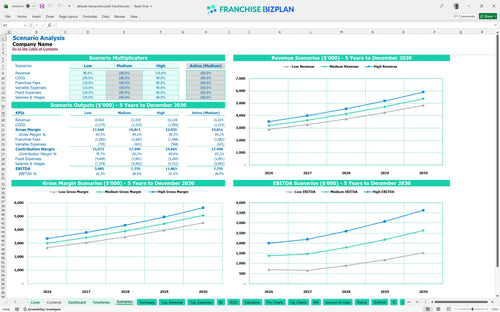
Three scenario analysis
Presentation ready
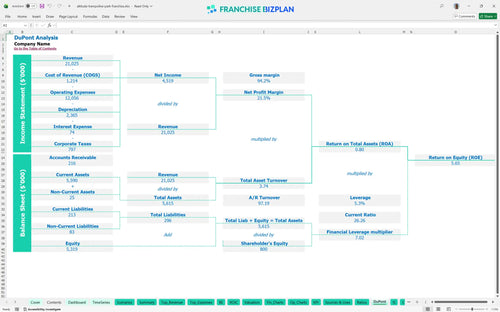
DuPont analysis
Researched revenue assumptions
Lender-friendly financial outputs
Revenue stream detailed view
Performance metrics benchmark
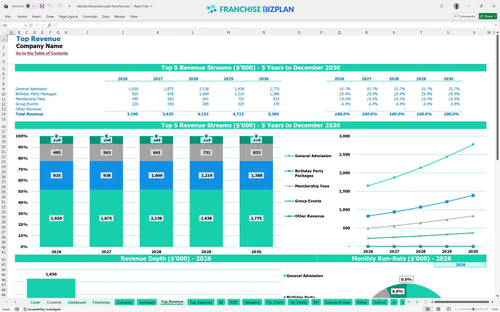
We built this franchise unit financial model using our own research to reflect the specific economics of this active-tainment concept. Key assumptions like the $50,000 franchise fee, 6% royalty, and 2% marketing fund are pre-populated alongside a projected year-one EBITDA of $1,126,000. These figures are fully editable, allowing you to stress-test the $3.19 million initial revenue target against your specific local market conditions.
This unit is projected to hit its break-even point in March 2026, just three months after the initial launch. Profitability is driven by high-margin birthday party packages and a growing monthly recurring revenue model for family entertainment franchise memberships.
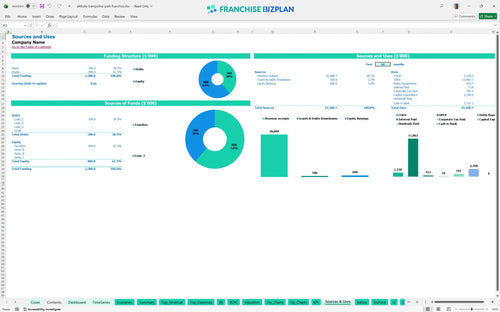
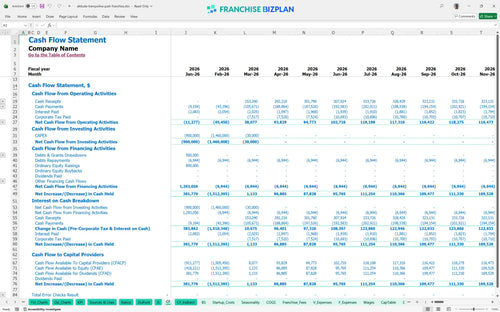
You will need approximately $2.39 million to get this location off the ground, covering the franchise fee, massive equipment needs, and pre-opening costs. The highest cash burn occurs in February 2026, reaching a low point of negative $1.13 million before operations stabilize.
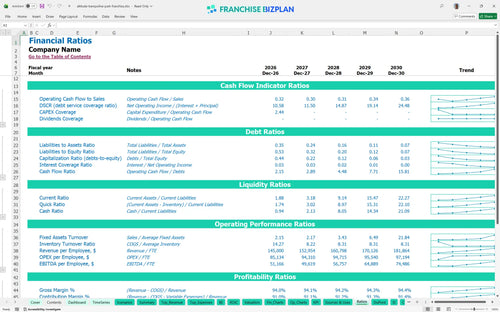
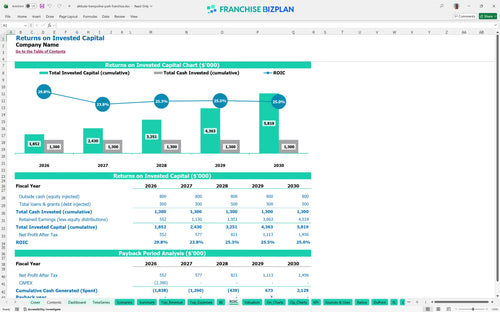
The financial feasibility study for indoor sports facilities shows an Internal Rate of Return (IRR) of 3.82% and a Return on Equity (ROE) of 5.65%. While the initial outlay is heavy, the 4-year payback period is typical for large-scale family entertainment centers with high asset intensity.
The franchise unit break-even analysis tool indicates you need to clear the $40,000 monthly rent and $10,000 utility bill quickly to stay afloat. Because fixed costs are high, your ability to reach break-even depends almost entirely on weekend foot traffic and party booking volume.
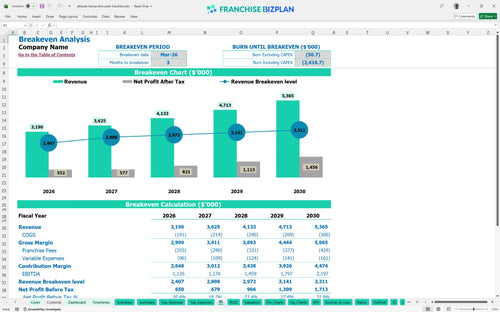
Your lowest cash point hits in February 2026, meaning you need a significant working capital buffer to handle the gap between construction and the first $1.1 million in general admission sales. This is a capital-intensive play where timing your equipment delivery is everyting to avoid burning cash too early.
The profitability analysis for FEC franchise owners shows that a 10% drop in revenue can significantly delay your 4-year payback. High-performance scenarios rely on maximizing throughput during peak hours and maintaining a $330,000 annual membership base to smooth out mid-week lulls and provide an oppurtunity for a 35% year-one margin.
This trampoline park franchise financial model is built in Excel with fully editable assumptions, allowing you to tweak every driver from ticket prices to safety staffing levels. You can adjust the pre-filled formulas to match your specific territory, whether you are looking at a high-traffic suburban hub or a smaller market. It is a flexible tool designed to handle the complexity of an indoor playground business plan without needing a degree in finance.

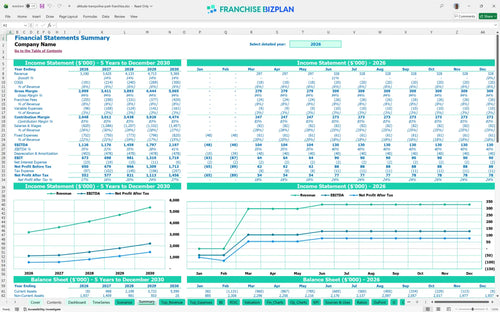
Planning for family entertainment center financial projections requires a long-term view of how equipment wear and membership growth impact the bottom line. This model provides a detailed 5-year outlook, showing revenue scaling from $3.19 million in year one to over $5.3 million by year five. It maps out the full trajectory of your cash flow and net profit so you can see the impact of maturing revenue streams over time.

The model simplifies franchise royalty fee calculator tasks by automating the 6% royalty and 2% brand marketing fund deductions from your gross sales. By accounting for the $50,000 initial fee and ongoing monthly obligations, you get a clear picture of your store-level EBITDA after all brand-related costs. This ensures you understand the real economics of operating the unit before you sign the agreement.

Knowing how to calculate startup costs for a trampoline park franchise is critical when your initial investment exceeds $2 million. This tool breaks down your capital expenditure planning for franchises, covering everything from the $850,000 leasehold improvements to the $650,000 trampoline systems. It identifies the exact sales volume needed to cover your $40,000 monthly rent and high labor costs, pinpointing your path to positive cash flow.

We integrated active-tainment business model benchmarks to help you verify if your labor and occupancy costs are in line with industry standards. If your safety supervisor payroll or cleaning supplies expenses drift too far from the norm, the model flags it for review. This sanity check is vital for a franchise unit profitability analysis, ensuring your projections stay grounded in the reality of high-volume entertainment venues.


Simply purchase and download the financial model template, then access it instantly using Microsoft Excel or Google Sheets. No installation or technical expertise required-just open and start working.

Enter your business-specific numbers, including revenue projections, costs, and investment details. The pre-built formulas will automatically calculate financial insights, saving you time and effort.

Leverage the investor-ready format to confidently showcase your financial projections to banks, franchise representatives, or investors. Impress stakeholders with clear, data-driven insights and professional reports.

Leverage the investor-ready format to confidently present your projections to banks, franchise representatives, or investors.