
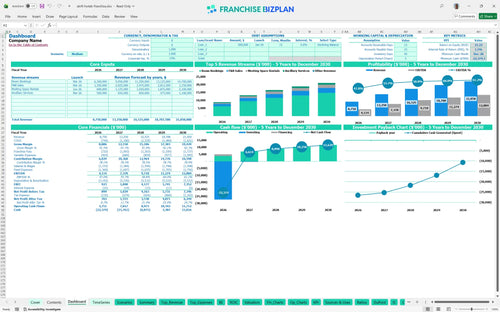
All-in-one Dashboard
Core inputs and core outputs


This Excel template for hotel franchise financial projections includes a comprehensive dashboard, detailed revenue streams, a full CAPEX schedule, and automated financial statements to streamline your investment analysis. This tool is the bridge between a dream and a bankable plan.
Core inputs and core outputs
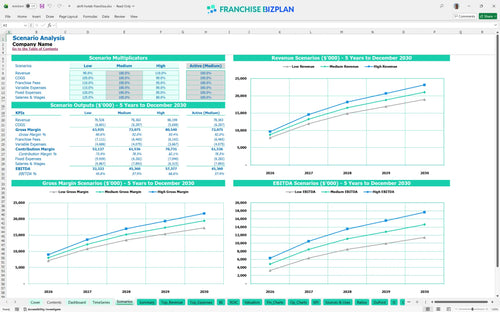
Three scenario analysis
Presentation ready
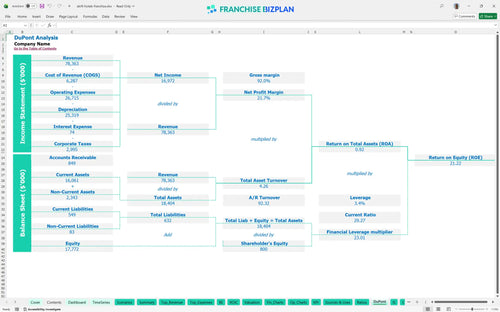
DuPont analysis
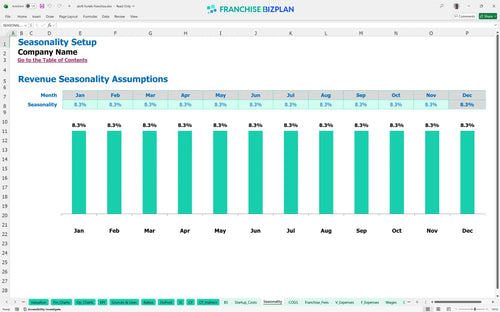
Researched revenue assumptions
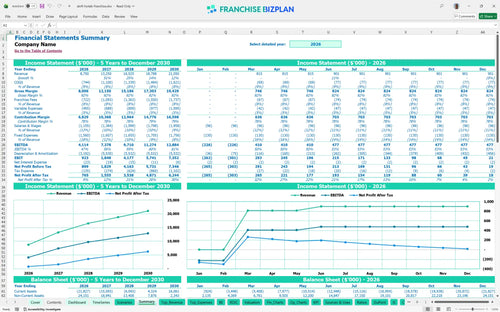
Lender-friendly financial outputs
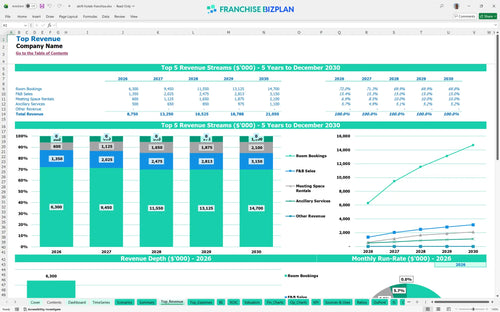
Revenue stream detailed view
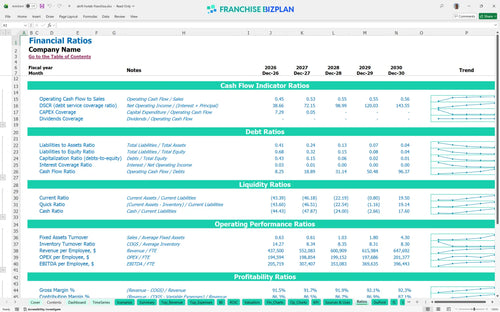
Performance metrics benchmark
We built this hotel business plan template using extensive research into the lifestyle hospitality sector to ensure every line item reflects reality. Key assumptions for room bookings, F&B sales, and those 5.5% royalty fees are pre-populated but fully editable, showing a Year 1 revenue potential of $8.75 million and EBITDA of $4.1 million. Real data beats a gut feeling every single time.
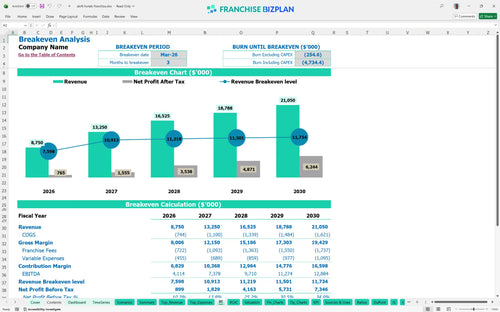
The unit shows strong initial performance with an EBITDA of $4.11 million in the first year, though true net profitability accounts for the heavy debt service and depreciation typical of a $27 million build. By year three, EBITDA climbs to $9.7 million as meeting space rentals and ancillary services reach full ramp-up. Early EBITDA looks strong, but watch those margins.
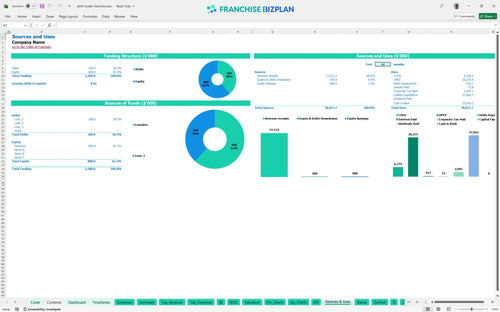
Launching this unit in the US requires a total initial investment of approximately $27.66 million, with the bulk directed toward construction and leasehold improvements. This financial model for new hotel development projects covers the $162,300 franchise fee, $1.5 million in tech systems, and an $800,000 pre-opening inventory buffer. Construction is your biggest check, so track it daily.
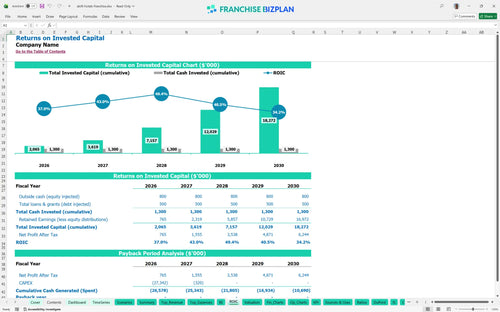
Investors can expect a Return on Equity (ROE) of 21.22% and an Internal Rate of Return (IRR) of 1.46% over the initial five-year hold. While the payback period extends defintely beyond year five due to the high upfront CAPEX, the steady climb in EBITDA to $12.8 million by year five suggests significant enterprise value. A long payback means you're playing the equity game.
The monthly break-even point is projected for March 2026, just three months after the primary launch, provided room bookings hit the $4.2 million annualized mark. Analyzing revenue streams for urban lifestyle hotel franchises shows that occupancy and ADR (Average Daily Rate) are the primary levers for covering the $130,000 monthly fixed overhead. Three months to breakeven is fast for a project this size.
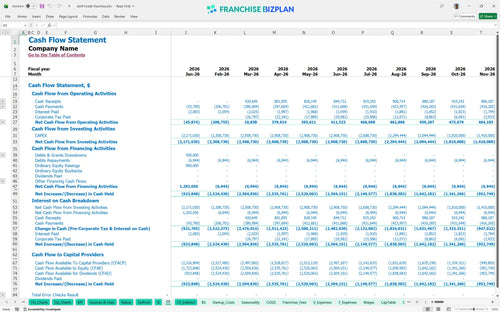
The lowest cash point is a significant -$22.37 million in December 2026, reflecting the peak of construction and equipment outlays before the revenue ramp fully offsets costs. You will need a robust hotel operational expense budget excel worksheet to manage this gap and ensure you have enough working capital to survive the first 12 months. The cash dip is deep, so keep your credit lines ready.
Using the franchise unit financial performance tracking template, we see that a 10% drop in occupancy (Low Case) pushes the cash trough deeper and delays the ROE recovery. Conversely, the High Case-driven by strong local marketing and corporate contracts-can push Year 5 EBITDA toward $15 million. High performance depends on winning the local corporate market.
Finance: update unit break-even and payback model by Friday
This hotel franchise financial model is built entirely in Excel, giving you full control over every variable from room rates to seasonal occupancy. All formulas are unlocked and the assumptions are pre-filled, so you can adapt the logic to your specific urban or suburban market without starting from scratch. Every cell is open for your specific market tweaks.

Planning a hospitality project requires a long-term lens, and this hotel investment pro forma delivers a detailed 60-month view of your fiscal health. It maps out the transition from construction into a mature operating state, showing how revenue scales from $8.75 million in year one to over $21 million by year five. Five years of data lets you see past the opening chaos.

Understanding the franchise royalty fee structure is vital because these costs eat into your store-level margin before you pay a single employee. The model automatically calculates the 5.5% royalty and 2.75% marketing fund contribution based on your monthly gross sales to ensure your cash flow projections are realistic. Royalties are a top-line hit you can't ignore.

Use the franchise startup cost calculator to aggregate everything from the $162,300 initial fee to the massive $15 million construction budget. By identifying your fixed costs like the $45,000 monthly lease and variable OTA commissions, you can pinpoint exactly when the unit stops burning cash. Knowing your zero-day is the best way to sleep at night.

We integrated hospitality industry benchmarking to help you validate your operating expenses forecasting against real-world standards. Whether you are estimating operating costs for boutique hotel franchises or a standard chain, the model provides a baseline for housekeeping supplies and labor ratios to keep your plan grounded. Don't guess on labor when industry averages are right here.


Simply purchase and download the financial model template, then access it instantly using Microsoft Excel or Google Sheets. No installation or technical expertise required-just open and start working.

Enter your business-specific numbers, including revenue projections, costs, and investment details. The pre-built formulas will automatically calculate financial insights, saving you time and effort.

Leverage the investor-ready format to confidently showcase your financial projections to banks, franchise representatives, or investors. Impress stakeholders with clear, data-driven insights and professional reports.

Leverage the investor-ready format to confidently present your projections to banks, franchise representatives, or investors.