
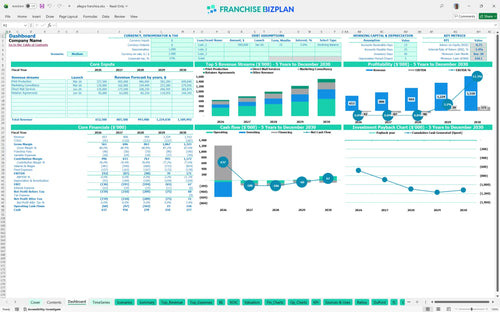
All-in-one Dashboard
Core inputs and core outputs


This small business franchise financial model excel provides a complete framework for estimating profitability for a new franchise location by integrating B2B service revenue streams with real-world operating costs.
Core inputs and core outputs
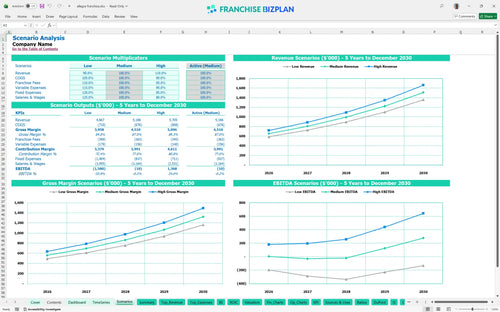
Three scenario analysis
Presentation ready
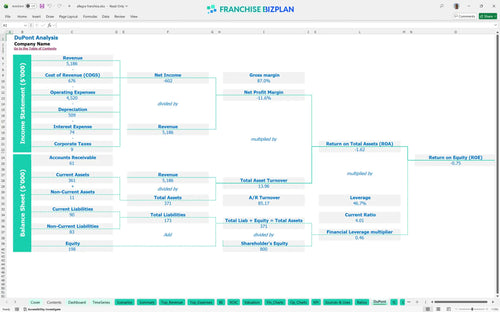
DuPont analysis
Researched revenue assumptions
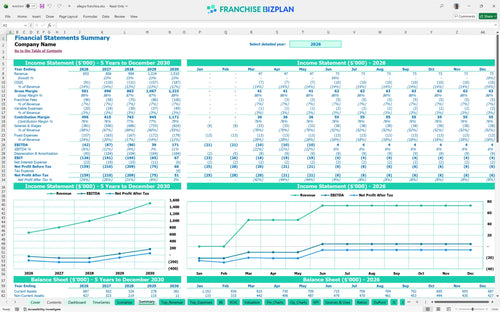
Lender-friendly financial outputs
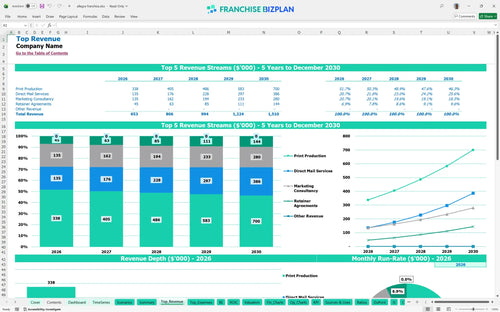
Revenue stream detailed view
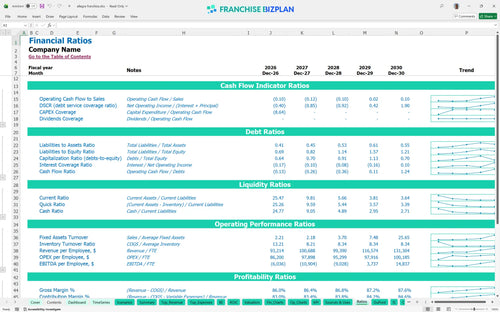
Performance metrics benchmark
We built this financial model using detailed research into the unit economics of a high-touch marketing and print services center. Key assumptions, including the 6% royalty fees and $9,500 monthly rent, are pre-populated and fully editable to match your specific location. With Year 1 revenue projected at $653,000, this tool helps you map a clear path to the $171,000 EBITDA target in Year 5.
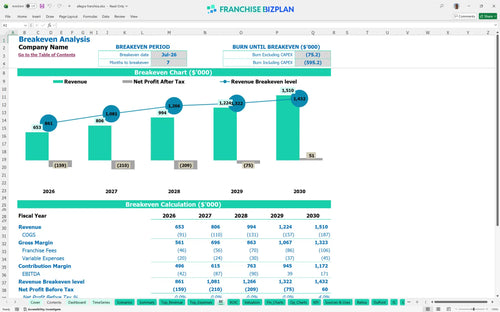
The unit reaches its monthly break-even point in July 2026, just seven months after opening. To be fair, bottom-line profitability takes longer; the model shows the unit turning EBITDA positive in Year 4 as high-margin marketing consultancy and retainer agreements begin to scale.
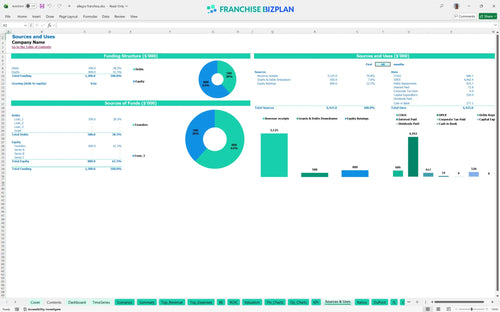
You will need approximately $520,000 to launch this unit, which covers the $45,000 franchise fee and significant capital expenditure planning for production gear. This startup budget worksheet for service-based franchise includes $180,000 for leasehold improvements and $120,000 for printing presses to meet the 24-hour turnaround brand standard.
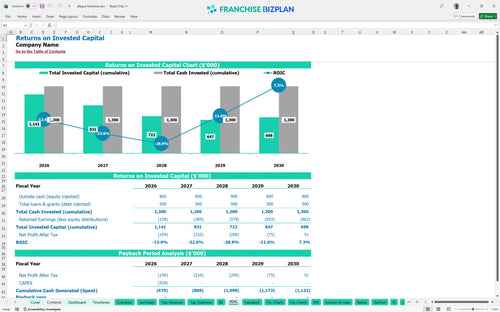
This ROI analysis shows a five-year IRR of -3.4%, reflecting the high initial investment and the time needed to build a B2B client base. Payback on your initial $520,000 capital occurs after Year 5, so this is defintely a long-term play focused on essential financial metrics for print shop owners like lifetime client value.
The monthly break-even point is achieved seven months after the March 2026 launch, provided you hit the $653,000 Year 1 revenue target. The primary driver for reaching this point is sales volume, as your $9,500 monthly rent and $85,000 general manager salary create a high fixed-cost floor.
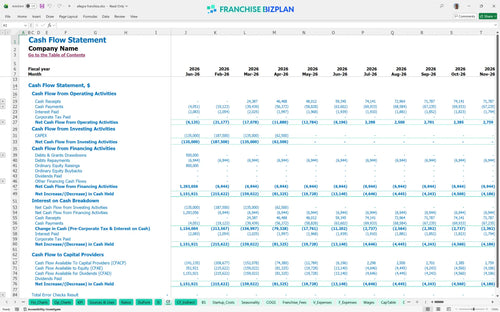
Your lowest cash point hits $210,000 in late 2029, meaning you need a significant cash buffer to survive the early years of negative EBITDA. This financial feasibility study for local marketing franchise suggests keeping at least six months of operating expenses in reserve to handle the ramp-up of the account management team.
In a high-growth scenario, aggressive local marketing execution can pull the Year 4 EBITDA well above the $39,000 baseline. This pre-written excel template for franchise business planning allows you to see how a 10% drop in revenue would extend your payback period and increase your peak cash need during the first three years.
Finance: update unit break-even and payback model by Friday.
This franchise financial model is built in Excel, allowing you to adjust every variable to fit your specific territory and local market conditions. It features editable assumptions and pre-filled formulas for revenue drivers and operating expenses, so you can easily simulate different growth paths or staffing levels without breaking the math.

A solid printing franchise business plan requires a long-term view to account for equipment depreciation and client acquisition cycles. This model provides a detailed 5-year outlook on revenue, cash flow, and profit, helping you visualize how the unit scales from a $653,000 Year 1 to over $1.5 million by Year 5.

This franchise investment calculator accurately tracks your ongoing obligations to the brand, including the 6% royalty and 1% marketing fund contributions. By analyzing franchise royalty and marketing fee structures automatically, the model ensures you see the true net margin after all brand-related costs are paid.

Learning how to calculate startup costs for a printing franchise is the first step toward a safe launch. This marketing franchise profitability analysis details the $520,000 initial investment and identifies the specific sales volume required to cover your $9,500 monthly rent and fixed overhead.

This printing and marketing franchise financial projection template uses researched benchmarks to help you sanity-check your projections against industry norms. Use the franchise unit economic performance template to compare your expected labor costs and gross margins to ensure your plan is realistic and competitive.


Simply purchase and download the financial model template, then access it instantly using Microsoft Excel or Google Sheets. No installation or technical expertise required-just open and start working.

Enter your business-specific numbers, including revenue projections, costs, and investment details. The pre-built formulas will automatically calculate financial insights, saving you time and effort.

Leverage the investor-ready format to confidently showcase your financial projections to banks, franchise representatives, or investors. Impress stakeholders with clear, data-driven insights and professional reports.

Leverage the investor-ready format to confidently present your projections to banks, franchise representatives, or investors.