
All-in-one Dashboard
Core inputs and core outputs


This detailed financial projection template for restaurant franchises includes integrated income statements, cash flow tracking, and CAPEX schedules to provide a complete picture of your investment.
Core inputs and core outputs
Three scenario analysis
Presentation ready
DuPont analysis
Researched revenue assumptions
Lender-friendly financial outputs
Revenue stream detailed view
Performance metrics benchmark
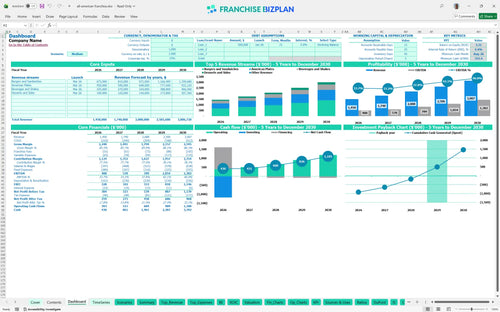
We built this All American Franchise franchise unit financial model using our own research to ensure it reflects real-world operations. Key assumptions like the $1.45 million year-one revenue and the 3% royalty fee are pre-populated and fully editable to fit your specific Nashville or urban location. This tool helps you move from a farm to table restaurant business plan template to a live, data-driven operating model.
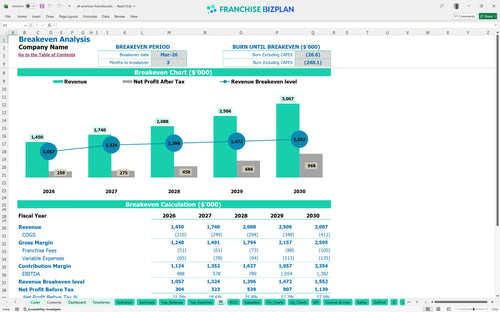
Your unit is projected to hit its break-even point in March 2026, just three months after launching. Profitability scales quickly, with EBITDA growing from $488,000 in the first year to $1.38 million by year five as you optimize your farm-to-table supply chain. Honestly, the speed of this ramp-up depends heavily on capturing high-volume lunch traffic early on.
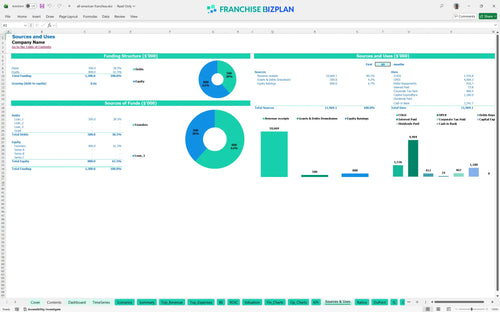
To get this unit off the ground, you will need roughly $1.18 million in total startup capital. This covers the $45,000 initial fee and significant leasehold improvements of $450,000 to hit that industrial-chic brand standard. You also need to account for $280,000 in kitchen equipment to handle the dual-operational lunch and dinner model effectively.
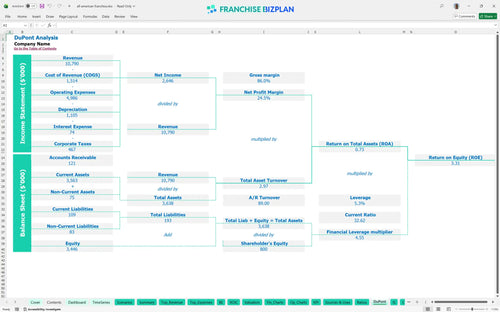
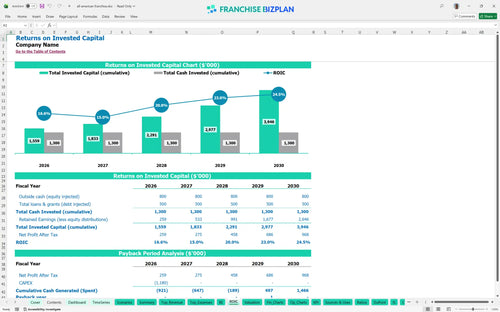
Financial planning for new franchise owners requires looking at the long-term win, and this model shows a 4-year payback period. With an Internal Rate of Return (IRR) of 4.36% and a Return on Equity (ROE) of 3.31, the investment is stable but requires disciplined execution. Still, the cash flow becomes quite robust once you clear the initial four-year hurdle.
The monthly break-even point occurs in March 2026, driven largely by the $18,000 monthly rent for a prime Gulch district location. To cover these high fixed costs, you need to maintain a steady flow of 'Express Lane' lunch customers and high-margin evening diners. If your average ticket drops even slightly, the time to reach break-even will defintely stretch out.
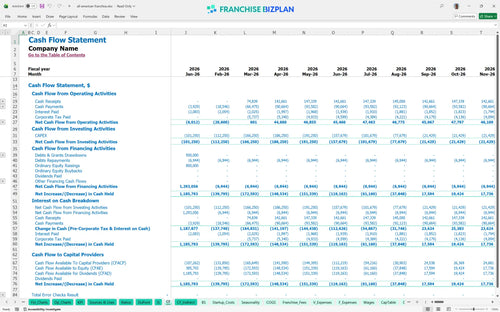
Your lowest cash point hits in August 2026, where the balance dips to $355,000 during the initial ramp-up phase. You need to maintain this buffer to handle the timing gaps between paying local Tennessee farmers and collecting daily receipts. Small business franchise financial modeling tools like this one help you see these 'valleys' before they happen so you can secure enough working capital.
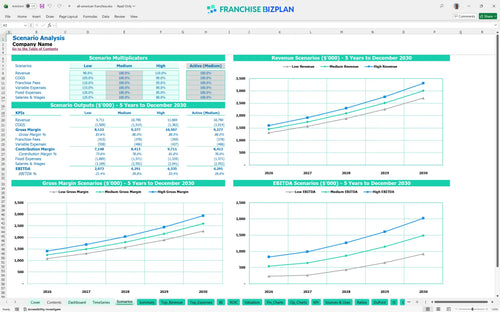
In a high-growth scenario, your year-5 EBITDA could exceed the $1.38 million base case if you maximize the live music revenue stream. Conversely, a low-revenue scenario might push your payback period beyond five years if labor costs for the dual-shift model aren't managed tightly. Estimating operating costs for a new franchise unit under these different lenses is the best way to de-risk your investment.
Finance: update unit break-even and payback model by Friday.
This franchise financial model template is built entirely in Excel, giving you total control over the underlying math. You can adjust pre-filled formulas and editable assumptions to match your specific territory, whether you are looking at a single location or a small chain. It is a flexible tool designed to help you use data to drive your site selection and operational planning without getting lost in complex spreadsheets.

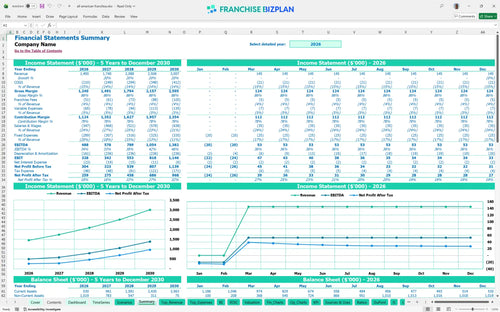
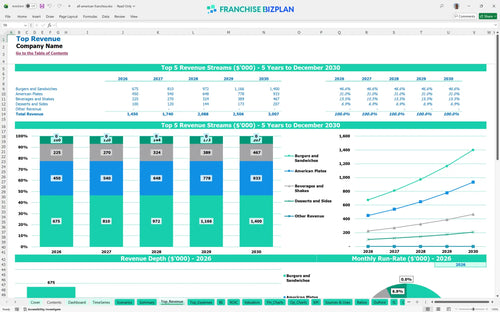
Planning for the long haul is vital, so we built this to provide franchise unit financial projections over a sixty-month horizon. You can track how revenue climbs from $1.45 million in year one to over $3 million by year five. This long-term view helps you see how store-level margin evolves as the unit matures and local demand stabilizes in your market.

The model handles the specific financial obligations that come with being a franchisee, such as the 3% royalty fee and the 0.5% marketing fund contribution. By automating these calculations, the franchise profitability analysis remains accurate even as your sales volume fluctuates. It ensures you know exactly how much cash stays in the unit after the franchisor takes their cut.

Calculating restaurant franchise startup costs in Excel is the first step to avoiding a cash crunch. This model maps out your capital expenditure budget, from the $45,000 franchise fee to the $450,000 leasehold improvements. It includes a detailed break-even analysis to show you exactly when your monthly sales will cover both your $18,000 rent and your variable food costs.

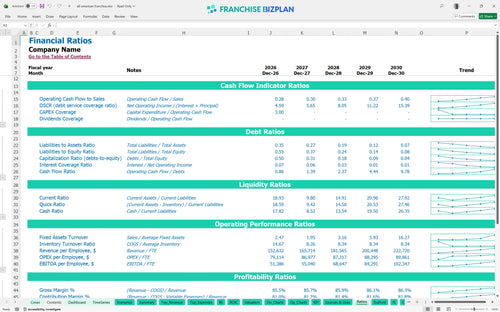
We have integrated franchise unit economics benchmarks to help you sanity-check your operating expense forecast. For instance, if your kitchen staff costs or prime location rent deviate too far from standard restaurant ranges, the model flags it. This allows you to compare your projected performance against typical industry standards for labor, occupancy, and gross margin.


Simply purchase and download the financial model template, then access it instantly using Microsoft Excel or Google Sheets. No installation or technical expertise required-just open and start working.

Enter your business-specific numbers, including revenue projections, costs, and investment details. The pre-built formulas will automatically calculate financial insights, saving you time and effort.

Leverage the investor-ready format to confidently showcase your financial projections to banks, franchise representatives, or investors. Impress stakeholders with clear, data-driven insights and professional reports.

Leverage the investor-ready format to confidently present your projections to banks, franchise representatives, or investors.