
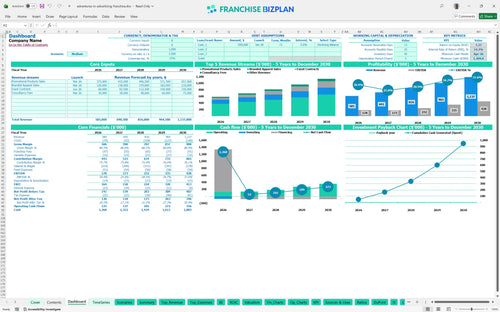
All-in-one Dashboard
Core inputs and core outputs


This franchise unit financial model template provides a complete Excel-based framework for revenue forecasting for marketing and branding franchise units and managing startup capital requirements.
Core inputs and core outputs
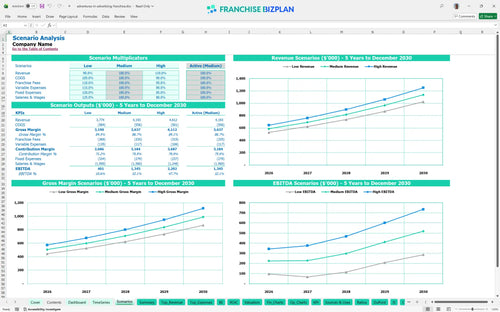
Three scenario analysis
Presentation ready
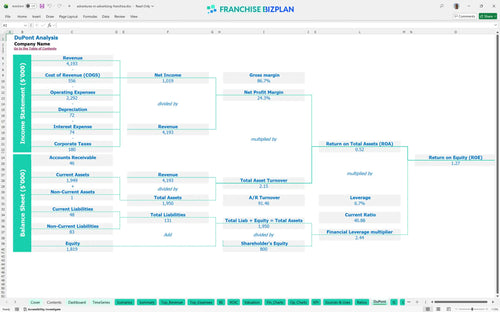
DuPont analysis
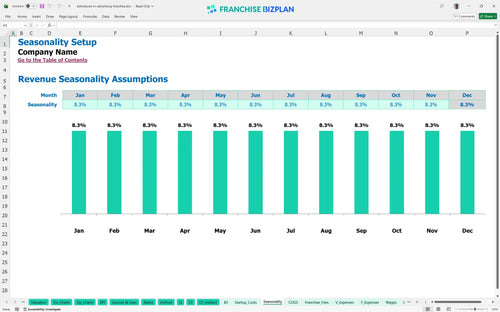
Researched revenue assumptions
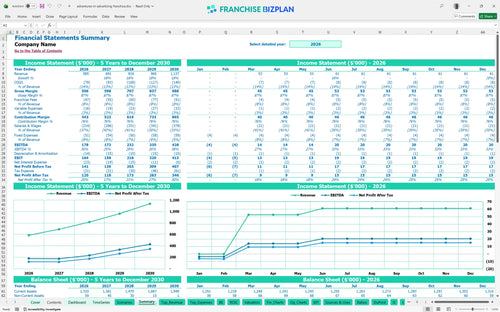
Lender-friendly financial outputs
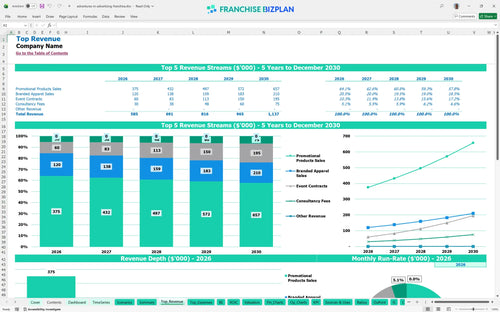
Revenue stream detailed view
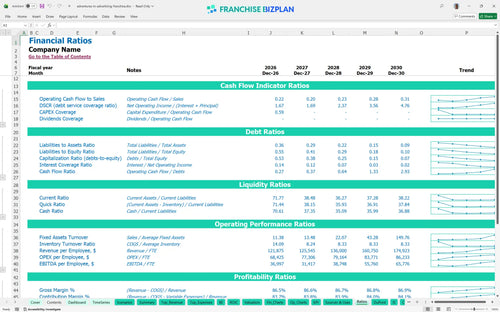
Performance metrics benchmark
We built this Adventures in Advertising Franchise franchise unit financial model using our own research to provide a realistic franchise profit and loss template. Key assumptions, including the $35,000 franchise fee, 8.0% royalty, and revenue streams like the $250,000 Year 1 promotional product sales, are pre-populated and fully editable. With an initial EBITDA of $178,000, this model helps you map out the specific financial trajectory of your branding agency.
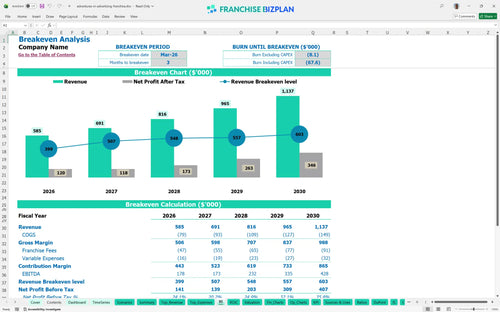
The unit reaches its break-even date in March 2026, just 3 months after the launch of the promotional products franchise. While Year 1 EBITDA is strong at $178,000, the model shows that true payback on the total investment occurs after Year 5. This timeline accounts for the 12.0% product procurement costs and the gradual ramp-up of event contracts and consultancy fees.
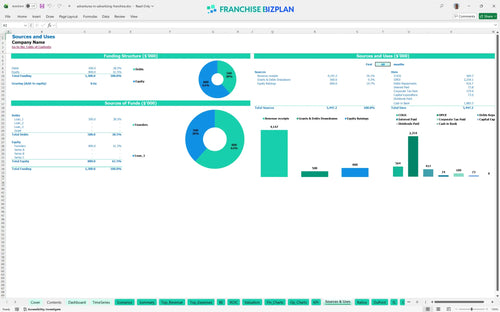
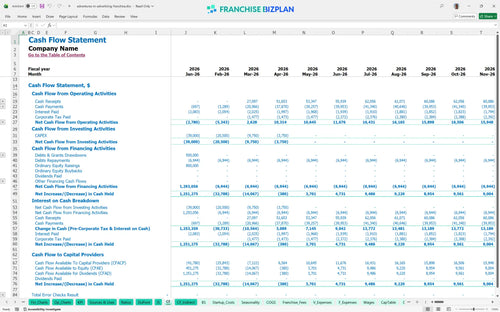
You will need a significant capital stack to launch, with the model showing a minimum cash requirement of $1,204,000 reaching its lowest point in April 2026. This covers the $35,000 franchise fee, $12,000 in leasehold improvements, and $8,500 for digital screens. Total startup costs for opening a promotional branding business include these CAPEX items plus an opening cash buffer for the first few months of operations.
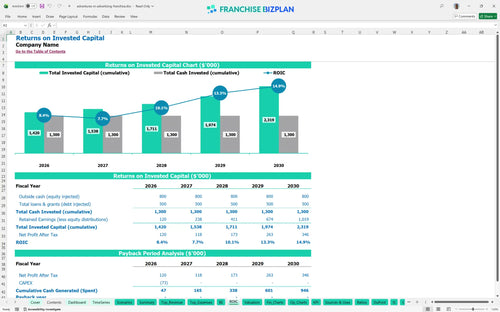
This investment offers an Internal Rate of Return (IRR) of 14.19% and a Return on Equity (ROE) of 1.27 based on the business unit financial forecasting. While the payback period extends beyond the five-year mark, the annual EBITDA grows steadily from $178,000 in Year 1 to $428,000 by Year 5. This suggests a business that builds significant value through long-term corporate contracts and recurring revenue.
The monthly break-even occurs in March 2026, which is quite fast for a marketing agency franchise model. The primary driver for hitting this goal is the $250,000 in Year 1 promotional product sales combined with keeping the $2,800 monthly showroom rent in check. If sales volume dips, the fixed labor costs for the $65,000/year General Manager will put immediate pressure on your break-even timing.
Your lowest cash point hits in April 2026 at $1,204,000, meaning you need substantial liquidity to survive the initial build-out and ramp-up. The model suggests a 3-month runway to break-even, but having an extra buffer is defintely smart to cover any delays in showroom maintenance or IT setup. Managing the timing of the $7,500 initial inventory purchase is vital for protecting your early cash position during the first 90 days.
Shifting between scenarios significantly impacts your Year 5 revenue, which ranges from $585,000 in Year 1 to $1,137,000 by Year 5 in the high-growth case. A low-revenue scenario could push the break-even date well past March 2026 and increase the peak cash need during the first year. High-performance scenarios, driven by better sales representative productivity, can dramatically improve the 14.19% IRR for the franchise unit.
To get a clear picture of your potential in the promotional industry, you need to look at the numbers. This model gives you the data-driven confidence to move forward with your investment or pivot your strategy. Finance: update unit break-even and payback model by Friday.
This franchise financial model template is built in Excel, allowing you to tweak every variable to fit your specific territory. Since it uses pre-filled formulas and editable assumptions, you can adjust for local rent or staffing needs without breaking the math. It is a flexible tool for testing different operating scenarios before you sign a lease or commit to a territory.

Planning for the long haul requires more than just a year-one estimate for your promotional merchandise franchise business plan. This model provides a detailed 5-year look at your revenue, cash flow, and profit to help you see the path to maturity. It includes a full balance sheet view, so you can track how your equity grows as the branding business scales over time.

Understanding your obligations to the franchisor is critical for protecting your bottom line and evaluating franchise investment opportunities in the promotional industry. The model calculates the 8.0% royalty fee and tracks the initial $35,000 franchise fee to show their impact on your net income. It ensures you account for every dollar sent upstream before calculating your actual store-level margin.

Starting a promotional products franchise involves several upfront costs, from showroom improvements to digital displays. This tool helps you estimate the total investment and identifies the exact sales volume needed to cover your monthly fixed costs. You will know exactly when the business stops burning cash and starts sustaining itself, which is vital for any franchise unit business plan and financial model excel.

We have baked in industry standards to help you verify if your projections for a branding agency franchise startup costs are realistic. You can compare your labor costs and gross margins against typical ranges for branding agencies and promotional merchandise firms. This sanity check ensures your business plan holds up under scrutiny from lenders or partners during a franchise investment analysis.


Simply purchase and download the financial model template, then access it instantly using Microsoft Excel or Google Sheets. No installation or technical expertise required-just open and start working.

Enter your business-specific numbers, including revenue projections, costs, and investment details. The pre-built formulas will automatically calculate financial insights, saving you time and effort.

Leverage the investor-ready format to confidently showcase your financial projections to banks, franchise representatives, or investors. Impress stakeholders with clear, data-driven insights and professional reports.

Leverage the investor-ready format to confidently present your projections to banks, franchise representatives, or investors.