
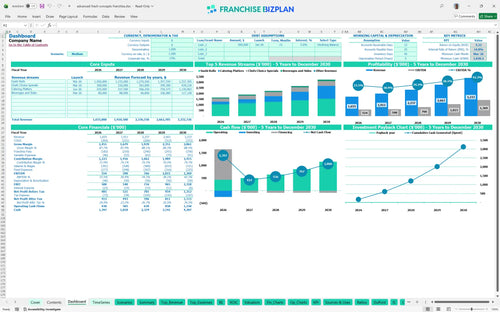
All-in-one Dashboard
Core inputs and core outputs


The franchise unit financial model template provides a complete toolkit including a 5-year P&L, startup cost breakdown, and automated ROI calculators for retail-based food service businesses.
Core inputs and core outputs
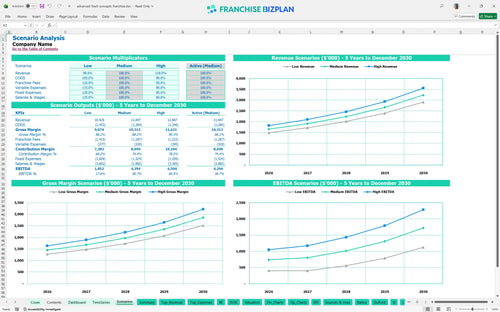
Three scenario analysis
Presentation ready
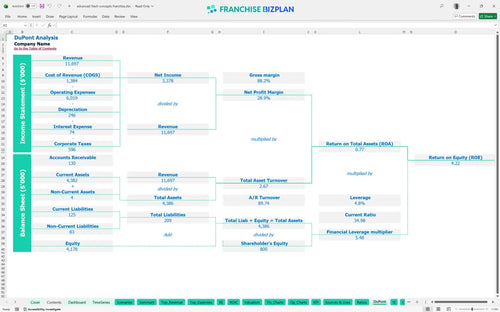
DuPont analysis
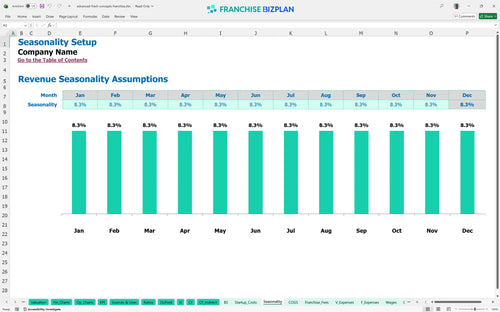
Researched revenue assumptions
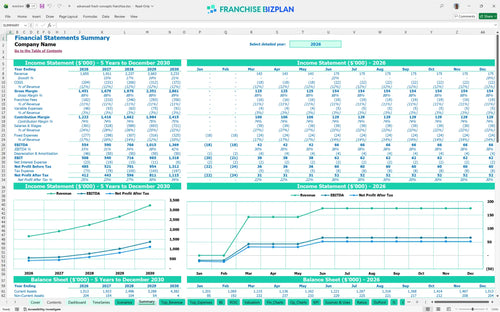
Lender-friendly financial outputs
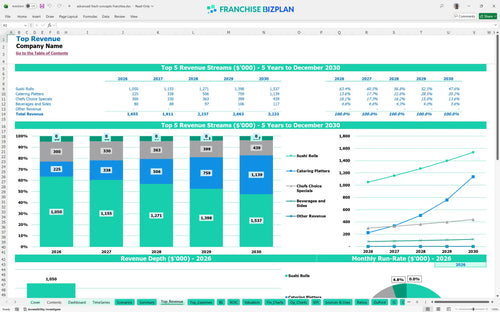
Revenue stream detailed view
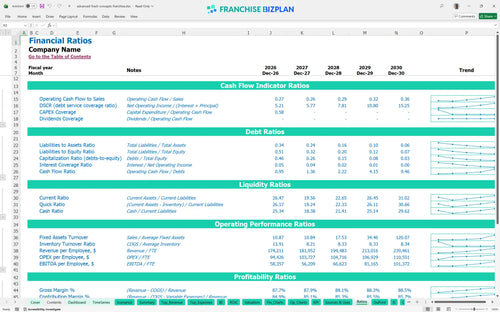
Performance metrics benchmark
We built this franchise unit financial model using our own research on premium sushi operations in high-traffic retail zones. Key assumptions like the 11% royalty and the $250,250 total initial equipment and build-out cost are pre-populated with researched data and are fully editable. This helps you evaluate the real-world potential of a unit doing $1.65M in its first year while accounting for high-end operating expense forecasting.
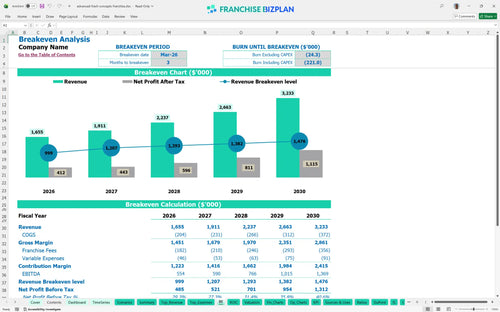
This unit hits its stride quickly, reaching the break-even point by March 2026, just three months after launch. By calculating net profit after the 11% royalty and $16,000 monthly rent, the model shows you becoming profitable within the first year with an EBITDA of $554,000.
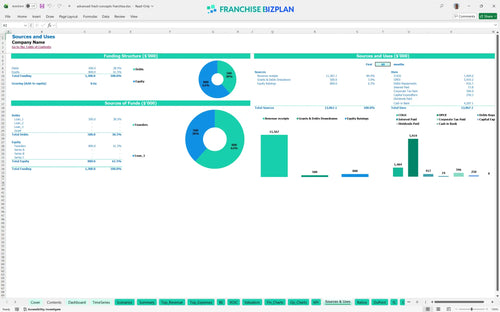
To get the doors open, you will need to fund $250,250 in hard startup costs plus a significant cash buffer, as the model shows a minimum cash requirement of $1.02M. This covers everything from the $6,250 franchise fee to the $90,000 leasehold improvements and initial kitchen equipment.
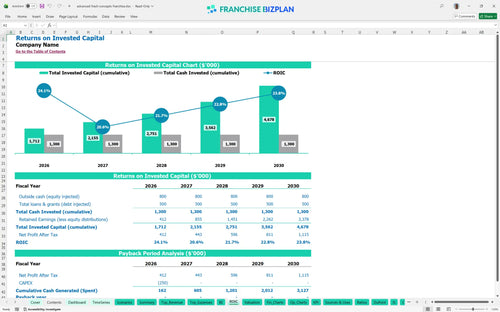
For this premium food service franchise, the internal rate of return (IRR) sits at 14.75% with a return on equity of 4.22. While the cash flow is strong, the high initial investment means the return on investment calculation shows full payback on the total capital occurs after year five.
Your monthly break-even happens in month three, driven largely by the high fixed cost of $16,000 for prime location rent. Here's the quick math: you need to move enough $700,000/year sushi roll volume to cover that rent and the 11% royalty burden before you see a dime of profit.
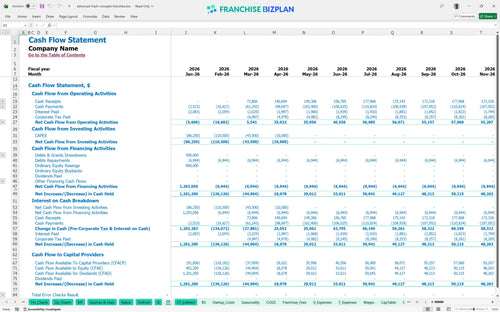
The lowest cash point occurs in March 2026 at $1.02M, which includes your operating buffer and initial losses during the three-month ramp-up. You need to watch this closely because if build-out delays push your opening back, that cash runway shrinks fast and increases working capital pressure.
Moving to a high-revenue scenario significantly changes your year-1 margin and helps you recover that $1.02M cash dip sooner. High-traffic locations make the difference here, especially if you can push catering platters beyond the base $150,000 forecast to hit the $3.2M year-5 target.
This franchise unit financial model lives in Excel, so you can tweak every assumption to fit your specific market. It comes with pre-filled formulas for revenue and costs, but you can easily change the numbers if your local rent or labor rates differ from the baseline. This makes it simple to use the franchise business plan template for different locations or operating scenarios.

We built this to track your growth from day one through year five, showing how revenue scales from $1.65M to over $3.2M. It maps out your sushi restaurant financial projection so you can see the impact of scaling your catering business alongside daily retail sales. This long-term view is essential for capital expenditure planning as your equipment ages and needs replacement.

Operating within a system means accounting for the 11% royalty fee right off the top of your gross sales. This model bakes those franchise-specific obligations into your monthly P&L so you aren't surprised by the cash outflow required to maintain brand standards. It ensures your franchise unit profitability analysis accounts for every dollar sent back to the home office.

Use the restaurant startup cost calculator to see exactly where your capital goes, from the $90,000 leasehold improvements to the $45,000 sushi theatre buildout. It calculates the exact sales volume you need to stop losing money and start covering your $16,000 monthly rent. Knowing your break-even analysis helps you manage the stressful first few months of operation.

We included benchmarks for things like seafood and produce costs, which start at 10.5% of sales in this model. These numbers help you defintely see if your kitchen waste or staffing levels are out of line with typical high-end retail food franchises. It is a vital tool for budgeting for sushi restaurant labor and food costs against industry norms.


Simply purchase and download the financial model template, then access it instantly using Microsoft Excel or Google Sheets. No installation or technical expertise required-just open and start working.

Enter your business-specific numbers, including revenue projections, costs, and investment details. The pre-built formulas will automatically calculate financial insights, saving you time and effort.

Leverage the investor-ready format to confidently showcase your financial projections to banks, franchise representatives, or investors. Impress stakeholders with clear, data-driven insights and professional reports.

Leverage the investor-ready format to confidently present your projections to banks, franchise representatives, or investors.