
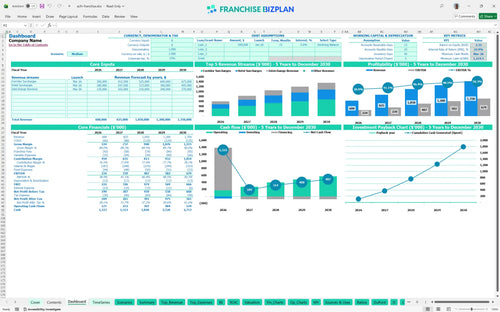
All-in-one Dashboard
Core inputs and core outputs


This ATM machine franchise financial projections template provides a complete roadmap for managing cash flow, capital expenditures, and multi-unit scaling in the automated teller industry.
Core inputs and core outputs
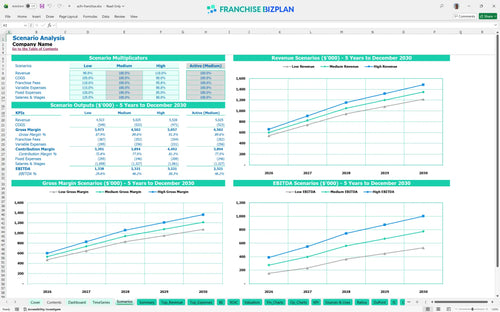
Three scenario analysis
Presentation ready
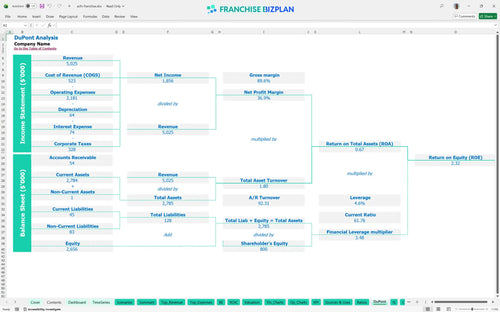
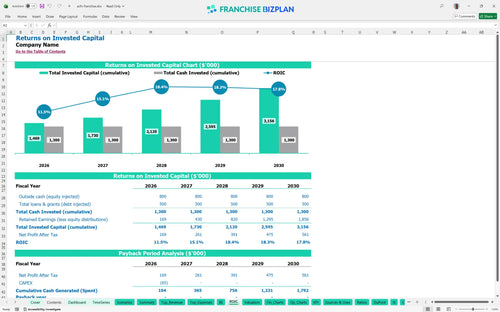
DuPont analysis
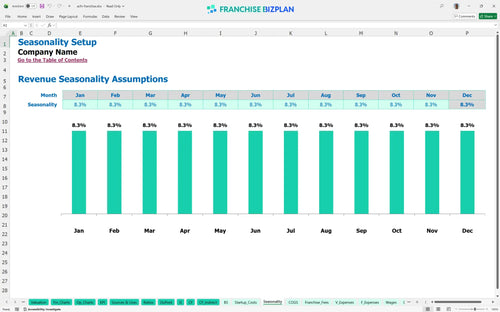
Researched revenue assumptions
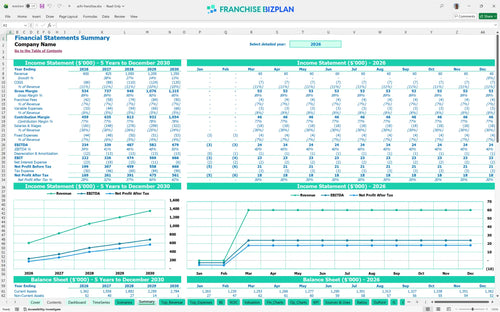
Lender-friendly financial outputs
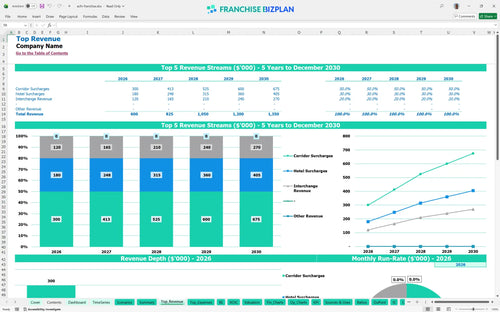
Revenue stream detailed view
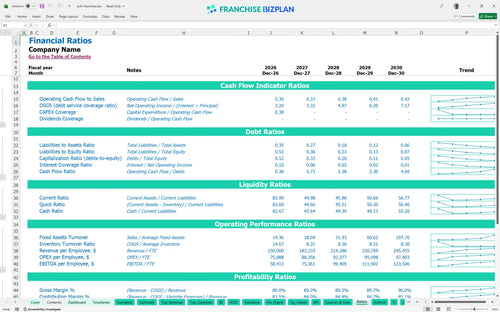
Performance metrics benchmark
We built this ACFN Franchise franchise unit financial model using our own research to help you navigate the ATM franchise business model. Key assumptions like the $600,000 year-one revenue and 22.89% IRR are pre-populated and fully editable to match your specific retail ATM placement strategy. This tool ensures you understand the relationship between surcharge volume and store-level EBITDA before you sign a lease.
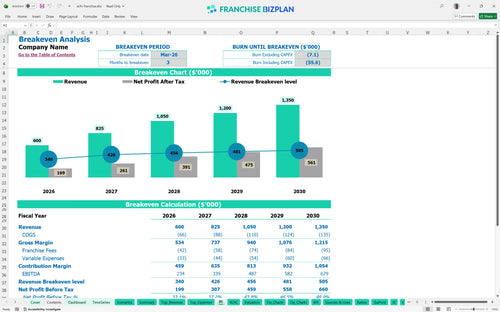
This unit reaches its break-even point in March 2026, just three months after launch. By year one, you are looking at an EBITDA of $234,000 after accounting for the 6% royalty and revenue share payouts to your host locations. This is tracked clearly in the ATM business profitability spreadsheet.
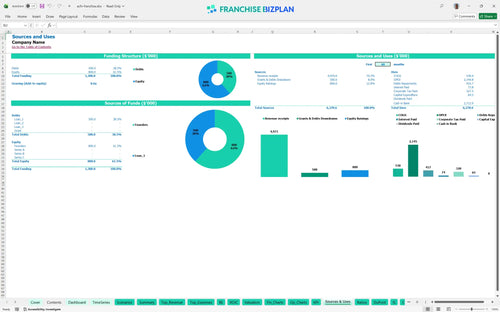
You need a total initial investment of $64,500 to launch this unit, which covers your $25,000 franchise fee and initial equipment. This includes a $10,000 cash float to ensure your machines are ready for immediate transaction volume. Knowing how to calculate ATM business startup costs is the first step to securing funding.
The model shows a strong internal rate of return (IRR) of 22.89% and a return on equity (ROE) of 2.32. While the full payback occurs after year five, the cash flow scales significantly as revenue grows toward $1.35 million. This franchise investment ROI remains competitive for those seeking passive income business opportunities.
You hit break-even in March 2026 by generating enough surcharge and interchange revenue to cover $3,900 in monthly fixed costs. Financial modeling for retail franchise units shows that the biggest driver for reaching this point is the volume of corridor and hotel surcharges, which total $320,000 in your first year.
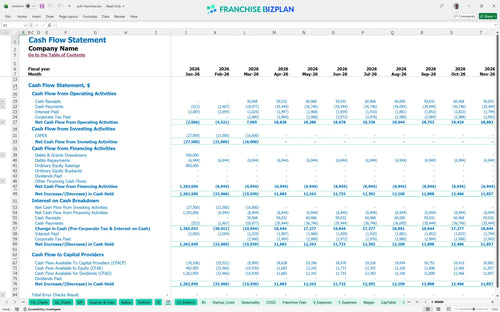
Your lowest cash point occurs in March 2026, requiring a minimum cash reserve of $1,215. To be fair, you should defintely maintain a larger buffer to handle fluctuations in cash loading requirements during peak tourism seasons. Use our tools to learn how to forecast cash flow for ATM businesses effectively.
Moving from a medium to a high-growth scenario significantly improves your year-one EBITDA. Higher transaction volumes reduce the impact of fixed costs like the $1,200 armored transport base. This model provides operational expense forecasting to show how ATM surcharge revenue sharing scales across different traffic levels.
Finance: update unit break-even and payback model by Friday.
This Excel template for franchise unit financial planning allows you to adjust every variable from surcharge rates to armored car frequency. You can modify pre-filled formulas to ensure the math fits your specific territory density and local market conditions. It is a flexible tool designed to handle the unique cash-heavy nature of the ATM franchise business model without requiring advanced accounting skills.

Long-term planning is vital when managing a fleet of machines across hotels and corridors. This model provides a step-by-step guide to ATM franchise financial modeling, forecasting performance through 2030. You can see how revenue scales from $600,000 in year one to $1.35 million by year five as you optimize machine placement and transaction volume.

Understanding your obligation to the franchisor is critical for maintaining store-level margin. The model automatically calculates the 6% royalty and 1% marketing fee against your surcharge and interchange revenue. It also incorporates best practices for ATM revenue sharing agreements, ensuring you track the 9.5% payout to host locations correctly from day one.

Use this franchise startup cost calculator to map out your initial $64,500 investment, including the $25,000 franchise fee and $16,500 for the first three terminals. Determining break-even point for ATM machine investments is simplified by identifying the exact moment transaction volume covers your $3,900 in monthly fixed costs.

We've integrated real-world data points, such as maintenance costs starting at 2.5%, to keep your projections realistic. These benchmarks help in evaluating profitability of ATM franchise locations by comparing your technician and loader wages against typical industry standards. This ensures your ATM business investment feasibility study is grounded in operational reality.


Simply purchase and download the financial model template, then access it instantly using Microsoft Excel or Google Sheets. No installation or technical expertise required-just open and start working.

Enter your business-specific numbers, including revenue projections, costs, and investment details. The pre-built formulas will automatically calculate financial insights, saving you time and effort.

Leverage the investor-ready format to confidently showcase your financial projections to banks, franchise representatives, or investors. Impress stakeholders with clear, data-driven insights and professional reports.

Leverage the investor-ready format to confidently present your projections to banks, franchise representatives, or investors.