
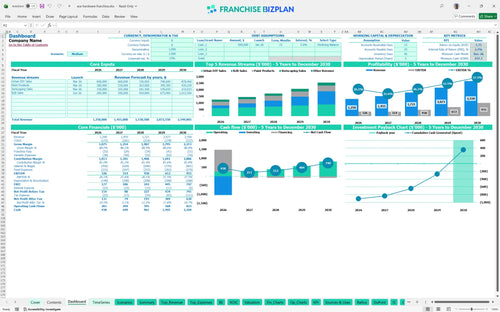
All-in-one Dashboard
Core inputs and core outputs


This franchise unit financial forecasting spreadsheet provides a complete toolkit for estimating hardware store profitability and ROI through detailed revenue, expense, and cash flow modules.
Core inputs and core outputs
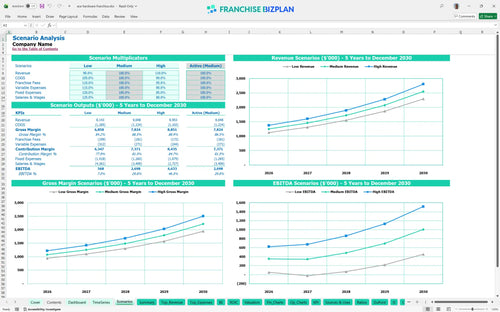
Three scenario analysis
Presentation ready
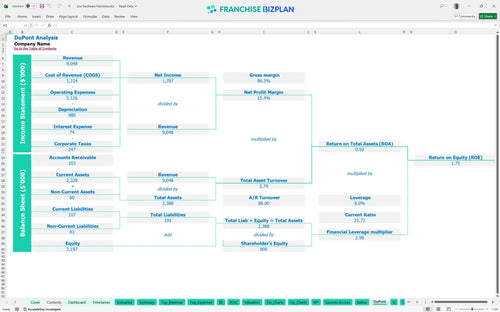
DuPont analysis
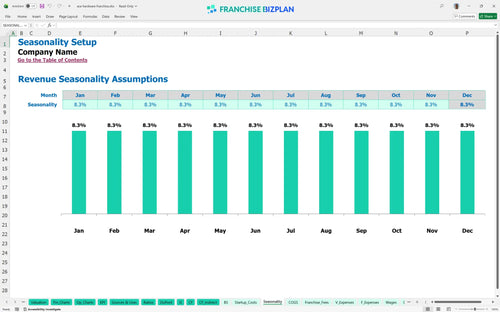
Researched revenue assumptions
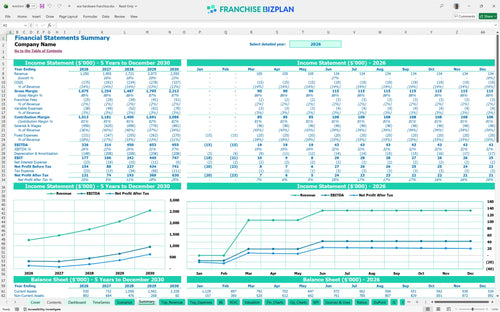
Lender-friendly financial outputs
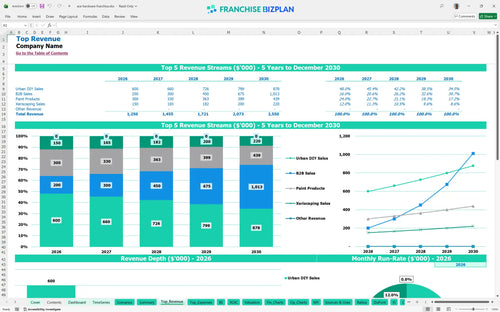
Revenue stream detailed view
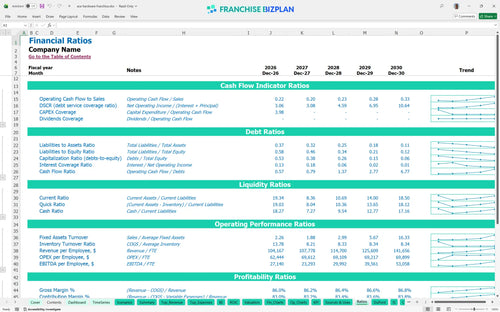
Performance metrics benchmark
We built this franchise unit financial model using our own research into the hardware retail sector to give you a head start. Key assumptions like the $1.25M year-one revenue target and the $1,040,000 initial CAPEX are pre-populated and fully editable to fit your specific market. This tool helps you bridge the gap between a business idea and a bank-ready financial model template for retail franchise owners.
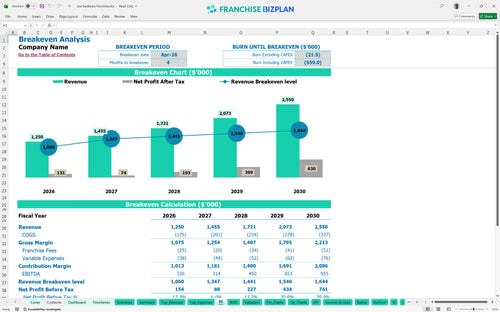
Based on the researched data, this franchise unit becomes profitable quickly, hitting its break-even date in April 2026. After accounting for COGS, the 2% marketing fee, and fixed costs like the $12,000 monthly rent, the model shows EBITDA climbing from $326,000 in Year 1 to $955,000 by Year 5.
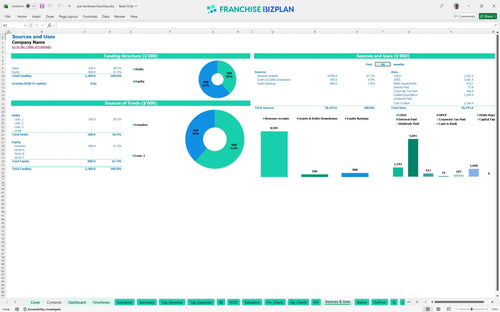
You need approximately $1,040,000 to launch this unit in the US, covering the $5,000 franchise fee and significant build-out costs. The calculation includes everything from the $450,000 leasehold improvements to the $40,000 POS and IT systems needed to run the store.
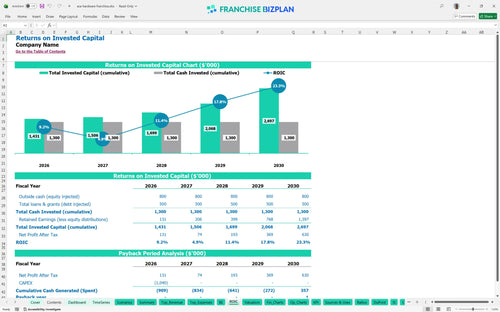
An investor can expect an Internal Rate of Return (IRR) of 2.74% and a Return on Equity (ROE) of 1.75 over the initial period. The model shows a 5-year payback period, which is standard for a high-CAPEX retail franchise with significant physical assets and inventory.
The monthly break-even point is reached in just 4 months, provided you hit the $1.25M annual revenue target in your first year. The biggest lever for reaching this point is managing the ramp-up of 'Urban DIY' sales and B2B procurement contracts to cover the $19,000+ in monthly fixed operating expenses.
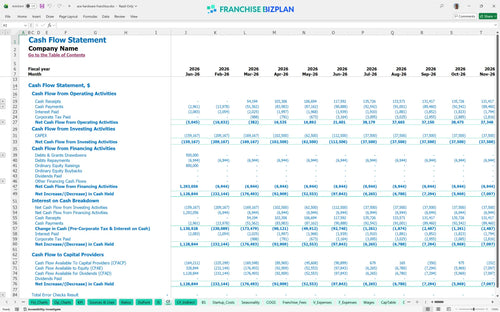
The lowest cash point occurs in December 2026 with a balance of $438,000, meaning you have a solid cushion if you start with the recommended capital. You need enough runway to handle the initial inventory load and the 4-month gap before the store reaches operational break-even.
Comparing scenarios shows that a High-case outcome, driven by better B2B sales execution, can push Year 5 EBITDA well beyond $955,000. Conversely, a Low-case scenario with slower foot traffic would extend the payback period and increase the peak cash need during the 2026 ramp-up phase.
This hardware store business plan tool is built in Excel to handle the specific moving parts of a retail operation. You can adjust pre-filled formulas and editable assumptions to match your specific territory, whether you are looking at a high-density urban spot or a suburban footprint. It makes capital expenditure planning simple by letting you toggle build-out costs and inventory levels to see how they impact your bottom line.

Mapping out a 5-year revenue forecast is essential for a retail franchise profitability analysis, especially when scaling from $1.25M to $2.55M in annual sales. This model tracks how B2B sales and specialized departments like paint or garden centers contribute to the cash flow over time. It provides a clear balance sheet view to help you manage long-term profitability and debt service as you grow from one unit to many.

Operating a retail unit means managing a specific franchise royalty fee structure where traditional royalties might be zero, but marketing fund contributions remain. This model tracks that 2% brand fund fee against your gross sales to ensure you see the true store-level margin. It helps you understand how these ongoing costs impact your retail inventory management forecasting and overall monthly contribution.

Knowing how to calculate startup costs for a hardware franchise is the difference between a smooth launch and a cash crunch. This tool includes a franchise startup cost calculator that covers everything from the $450,000 leasehold improvements to the $150,000 in shelving and fixtures. It performs a break-even analysis for franchisees so you know exactly which month your operation turns the corner and starts covering its own fixed costs.

We defintely need to compare your store against the rest of the sector to ensure your operating expense analysis is realistic. The model uses essential financial metrics for retail franchise operations, such as labor cost benchmarks and occupancy targets, to validate your plan. This helps you sanity-check if your 11% COGS for hardware goods is in line with top-performing units in similar high-density districts.


Simply purchase and download the financial model template, then access it instantly using Microsoft Excel or Google Sheets. No installation or technical expertise required-just open and start working.

Enter your business-specific numbers, including revenue projections, costs, and investment details. The pre-built formulas will automatically calculate financial insights, saving you time and effort.

Leverage the investor-ready format to confidently showcase your financial projections to banks, franchise representatives, or investors. Impress stakeholders with clear, data-driven insights and professional reports.

Leverage the investor-ready format to confidently present your projections to banks, franchise representatives, or investors.