
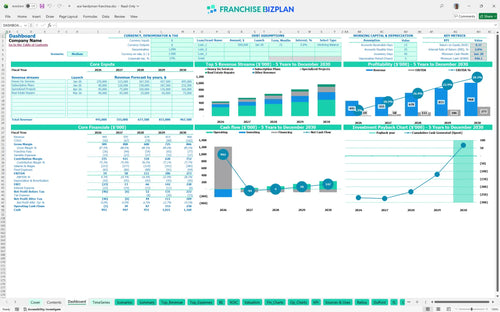
All-in-one Dashboard
Core inputs and core outputs


This franchise unit financial model template provides a complete toolkit for calculating ROI for home service franchise investments, including automated P&L, cash flow, and balance sheet reports.
Core inputs and core outputs
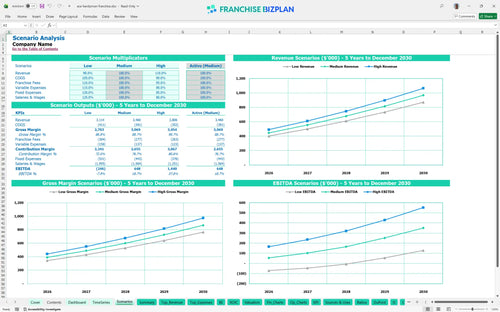
Three scenario analysis
Presentation ready
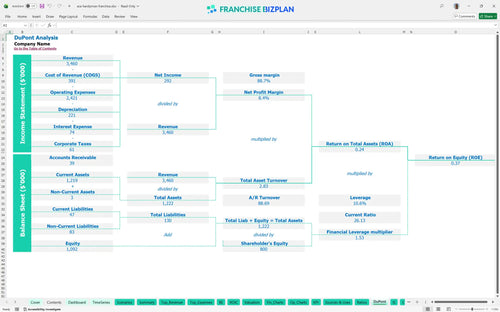
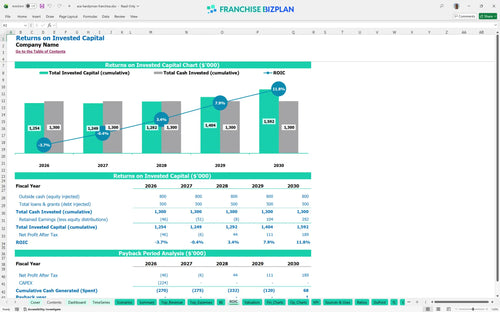
DuPont analysis
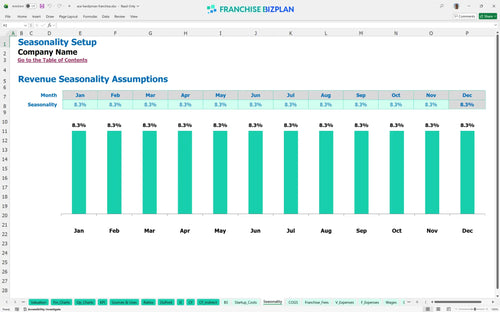
Researched revenue assumptions
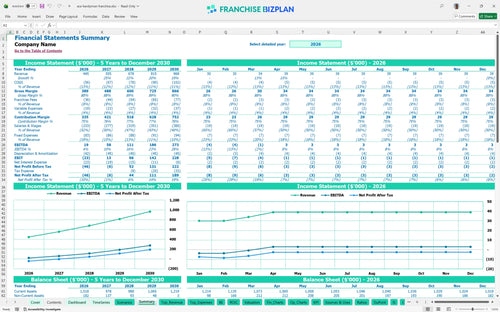
Lender-friendly financial outputs
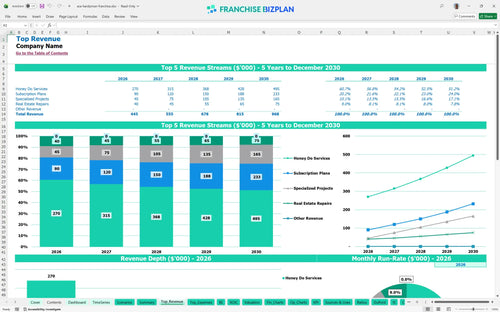
Revenue stream detailed view
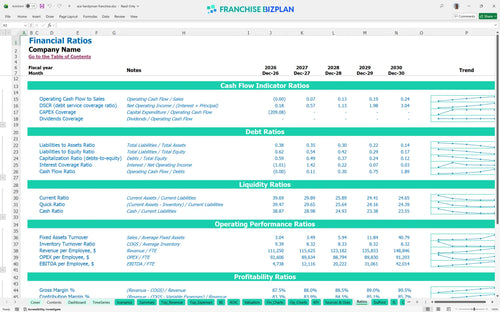
Performance metrics benchmark
We built this franchise unit financial model using our own research into the home service sector to provide a realistic roadmap for prospective owners. Key assumptions, including the $70,000 franchise fee and 6% royalty, are pre-populated with researched data specific to this handyman franchise and are fully editable. With year one revenue starting at $445,000 and EBITDA scaling to $273,000 by year five, this tool gives you the data-driven confidence needed for financial benchmarking for handyman business startups.
This franchise unit becomes profitable in its first year of operation, generating an initial EBITDA of $19,000. By year five, the net profit trajectory climbs to $273,000 as you scale revenue through recurring subscription plans and specialized repair projects.
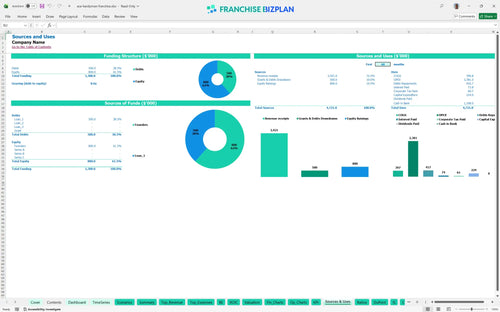
Launching this unit in the US requires an initial capital outlay that covers the $70,000 franchise fee and significant equipment costs. The total investment includes $80,000 for service vans and $30,000 for the office fit-out to ensure a professional 'white-glove' service standard from day one.
Based on the researched data, you can expect a payback period of 5 years on your total investment. The model estimates an internal rate of return (IRR) of 2.01% and a return on equity (ROE) of 0.37, reflecting the steady growth of a service-based recurring revenue model.
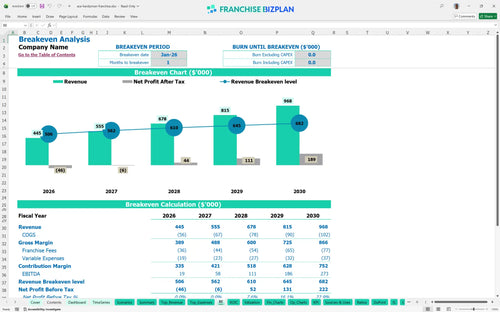
The unit hits its monthly break-even point in January 2026, just one month after the official launch. This fast start is possible because fixed costs, like the $3,500 monthly rent and $500 general liability insurance, are manageable relative to the high average ticket of specialized projects.
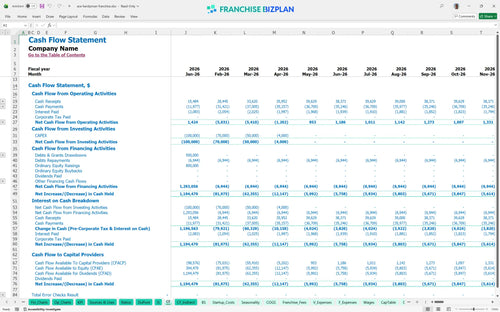
The lowest cash balance occurs in January 2028 at $946,000, which suggests the model assumes a very strong initial funding position. You will defintely want to monitor the timing between paying your technicians and receiving payments from real estate repair jobs to protect your cash flow management for local home service businesses.
Switching between low, medium, and high scenarios shows how sensitive the $273,000 year-five EBITDA is to technician productivity and local marketing execution. High-performing units reach the $968,000 revenue target faster by maximizing the 'buy-to-install' leads from nearby retail partners.
This franchise unit financial model is built in Excel with fully editable assumptions and pre-filled formulas, allowing you to tweak every variable for your specific territory. You can adjust local labor rates, rent, and service pricing to see how they impact your unit economics analysis in real-time. It is a flexible tool designed to handle the unique math of a home service franchise business plan without the headache of building a spreadsheet from scratch.

Plan your multi-year growth with detailed home service franchise financial projections that cover everything from your first hire to a mature five-year operation. The model tracks revenue scaling from $445,000 in year one to $968,000 by year five, providing a clear view of long-term cash flow and profit potential. It is the essential profit and loss statement template for any operator looking to understand the marathon of franchise ownership.

This model captures the specific financial obligations of your agreement, including the $70,000 initial fee and ongoing franchise royalty fees. We have baked in the 6% royalty and 2% marketing fund contributions so you can see exactly how much goes to the franchisor before you pay your local bills. It simplifies the complex task of calculating monthly brand fund obligations as your revenue grows.

Use this franchise startup costs spreadsheet to estimate your total initial investment, including equipment like service vans and office fit-outs. The model calculates the exact sales volume you need to cover your fixed costs, such as the $3,500 monthly rent and $2,800 in total monthly insurance premiums. Knowing your break-even point helps you manage stress during the critical first few months of operation.

The model includes built-in benchmarks for the home repair sector to help you sanity-check your labor and material costs. You can compare your projected gross margins against typical industry ranges to ensure your small business financial forecasting stays grounded in reality. This feature helps you identify if your technician wages or material costs are drifting too far from the standard unit model.


Simply purchase and download the financial model template, then access it instantly using Microsoft Excel or Google Sheets. No installation or technical expertise required-just open and start working.

Enter your business-specific numbers, including revenue projections, costs, and investment details. The pre-built formulas will automatically calculate financial insights, saving you time and effort.

Leverage the investor-ready format to confidently showcase your financial projections to banks, franchise representatives, or investors. Impress stakeholders with clear, data-driven insights and professional reports.

Leverage the investor-ready format to confidently present your projections to banks, franchise representatives, or investors.