
All-in-one Dashboard
Core inputs and core outputs


This franchise unit financial projection includes a complete set of financial statements, CAPEX schedules, and scenario tools to evaluate your hotel investment.
Core inputs and core outputs
Three scenario analysis
Presentation ready
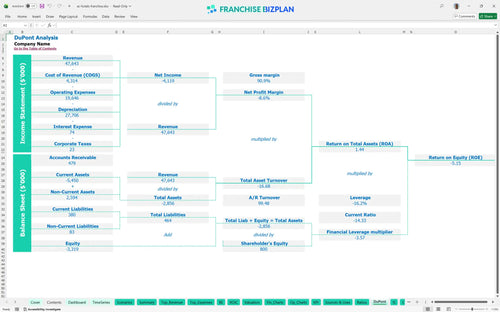
DuPont analysis
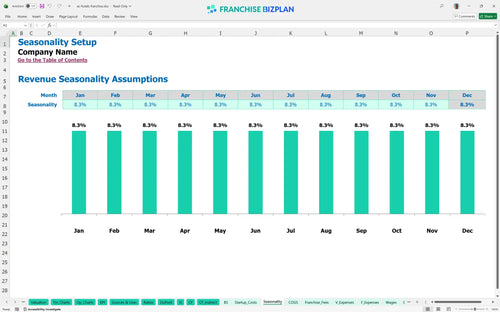
Researched revenue assumptions
Lender-friendly financial outputs
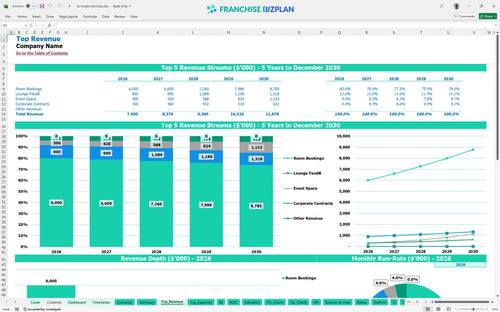
Revenue stream detailed view
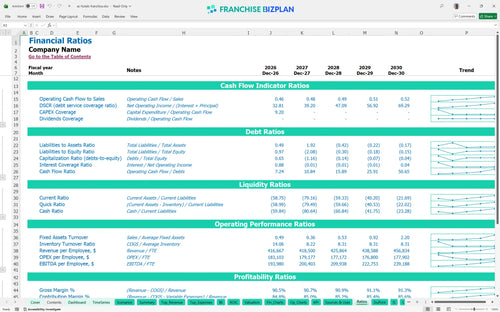
Performance metrics benchmark
We developed this financial model using detailed research on upscale lifestyle hotel operations. Every assumption, from the $4 million in room bookings to the 6% royalty fee, is pre-populated and fully editable to help you evaluate this $30.3 million investment opportunity. This hotel franchise unit profitability analysis tool ensures you have a data-driven view of your potential returns.
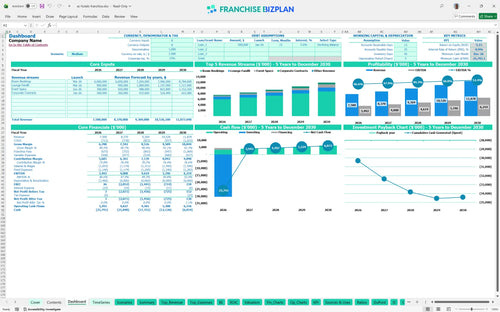
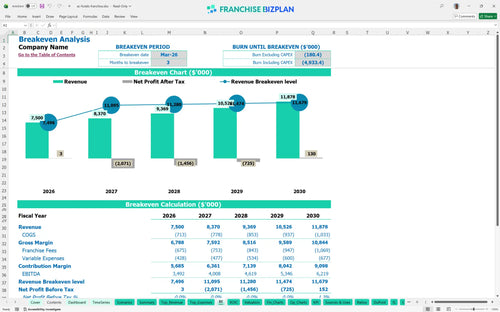
The unit reaches operational breakeven by March 2026, just three months after launching room bookings. While Year 1 EBITDA is a strong $3.49 million, the negative IRR of -0.88% suggests that reaching true net profitability takes longer due to the $30 million initial development cost.
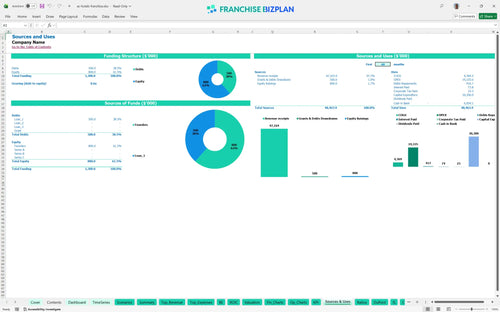
To launch this lifestyle hotel franchise, you need a total investment of $30.3 million. This capital expenditure budget is heavily weighted toward construction and guest room outfitting, including the $115,000 initial franchise fee and $20 million for building construction.
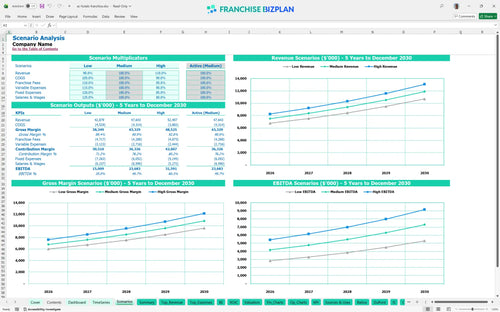
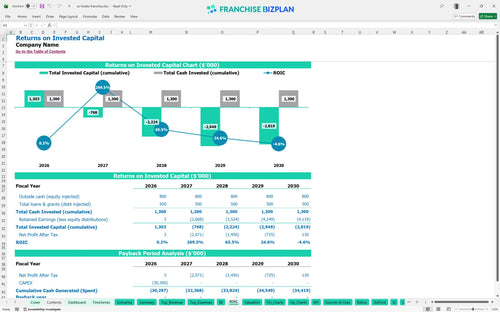
The projected ROI for boutique hotel franchise units in this segment shows a payback period extending beyond Year 5. With a Year 5 EBITDA of $6.2 million and a negative ROE of -5.15%, this is a long-term asset play where value is built through appreciation and steady cash flow growth.
The unit hits break-even in March 2026, driven by the launch of $4 million in annual room bookings. Your biggest challenge is managing the operating expense forecast, specifically the $40,000 monthly ground lease and the $160,000 annual GM salary, which create a high fixed-cost floor.
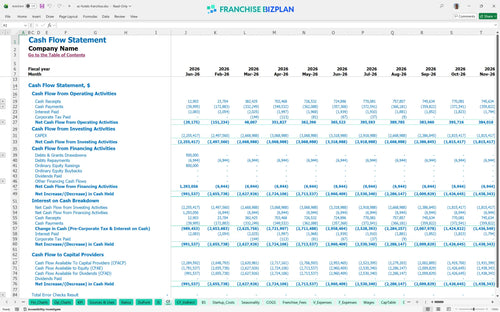
The lowest cash point is defintely December 2026 at -$25.79 million, reflecting the peak of construction and pre-opening spend. You must secure robust financing to cover this gap before the Year 2 revenue of $8.37 million begins to stabilize the hotel franchise operational budget template excel.
Financial modeling for hotel development projects shows that a 10% revenue swing can drastically change your Year 1 EBITDA of $3.49 million. High-performance scenarios rely on aggressive local marketing to boost the $200,000 event space revenue and increase the average ticket in the lounge.
This hotel franchise financial model provides a flexible Excel framework to stress-test your hospitality investment. You can adjust the pre-filled formulas and editable assumptions to match your specific market, whether you are tweaking room rates or refining your Excel template for hotel franchise financial forecasting.

Building a long-term roadmap is essential for high-capital hospitality projects. This franchise business plan template delivers a detailed 5-year outlook, projecting revenue growth from $7.5 million in Year 1 to over $11.8 million by Year 5, ensuring you can track the ramp-up of room bookings and corporate contracts.

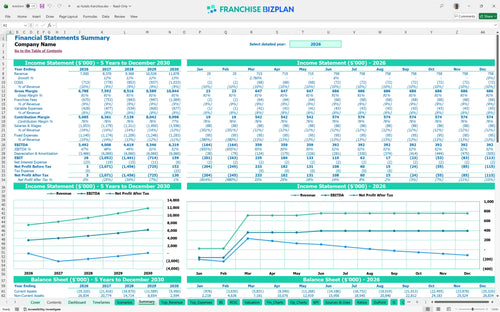
Managing ongoing brand costs is vital for maintaining store-level margins. This model integrates the specific franchise royalty fee structure, including a 6% royalty and 3% marketing fund contribution, so you can see the exact impact of brand fees on your bottom line before local overhead hits.

Launching a hotel requires massive upfront capital, and this hospitality startup cost calculator maps out the entire $30.3 million investment. Use the break-even analysis for hotel franchise unit planning to determine exactly when your occupancy and average daily rate will cover your $95,000 monthly fixed costs.

This hotel investment feasibility study includes built-in benchmarks to help you sanity-check your operational assumptions. By comparing your RevPAR analysis (Revenue Per Available Room) and labor costs against industry standards, you can ensure your projections for guest amenities and lounge staffing remain competitive.


Simply purchase and download the financial model template, then access it instantly using Microsoft Excel or Google Sheets. No installation or technical expertise required-just open and start working.

Enter your business-specific numbers, including revenue projections, costs, and investment details. The pre-built formulas will automatically calculate financial insights, saving you time and effort.

Leverage the investor-ready format to confidently showcase your financial projections to banks, franchise representatives, or investors. Impress stakeholders with clear, data-driven insights and professional reports.

Leverage the investor-ready format to confidently present your projections to banks, franchise representatives, or investors.